Part 10: Cloud Computing with Fog computing

Part 10: Cloud Computing with Fog computing

Cloud Computing and Fog Computing

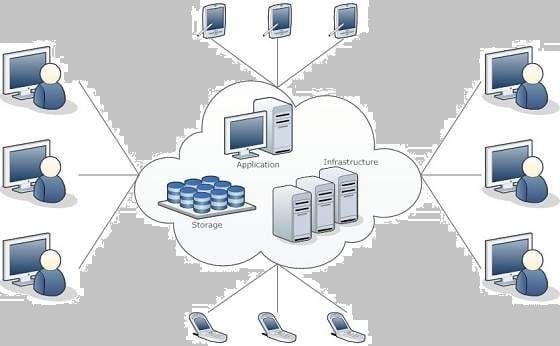
Cloud Computing: The delivery of on-demand computing services is known as cloud computing. We can use applications to storage and processing power over the internet. It is a pay as you go service. Without owning any computing infrastructure or any data centers, anyone can rent access to anything from applications to storage from a cloud service provider. We can avoid the complexity of owning and maintaining infrastructure by using cloud computing services and pay for what we use. In turn, cloud computing services providers can benefit from significant economies of scale by delivering the same services to a wide range of customers.

Fog Computing:

Fog computing is a decentralized computing infrastructure or process in which computing resources are located between the data source and the cloud or any other data center. Fog computing is a paradigm that provides services to user requests at the edge networks. The devices at the fog layer usually perform operations related to networking such as routers, gateways, bridges, and hubs. Researchers envision these devices to be capable of performing both computational and networking operations, simultaneously. Although these devices are resource-constrained compared to the cloud servers, the geological spread and the decentralized nature help in offering reliable services with coverage over a wide area. Fog computing is the physical location of the devices, which are much closer to the users than the cloud servers.

Many people use the terms fog computing and edge computing interchangeably because both involve bringing intelligence and processing closer to where the data is created. This is often done to improve efficiency, though it might also be done for security and compliance reasons.

The fog metaphor comes from the meteorological term for a cloud close to the ground, just as fog concentrates on the edge of the network. The term is often associated with Cisco; the company’s product line manager, Ginny Nichols, is believed to have coined the term. Cisco Fog Computing is a registered name; fog computing is open to the community at large.

History of fog computing

In 2015, Cisco partnered with Microsoft, Dell, Intel, Arm and Princeton University to form the OpenFog Consortium. Other organizations, including General Electric (GE), Foxconn and Hitachi, also contributed to this consortium. The consortium’s primary goals were to both promote and standardize fog computing. The consortium merged with the Industrial Internet Consortium (IIC) in 2019.

Fog computing vs. edge computing

According to the OpenFog Consortium started by Cisco, the key difference between edge and fog computing is where the intelligence and compute power are placed. In a strictly foggy environment, intelligence is at the local area network (LAN), and data is transmitted from endpoints to a fog gateway, where it’s then transmitted to sources for processing and return transmission.

In edge computing, intelligence and power can be in either the endpoint or a gateway. Proponents of edge computing praise its reduction of points of failure because each device independently operates and determines which data to store locally and which data to send to a gateway or the cloud for further analysis. Proponents of fog computing over edge computing say it’s more scalable and gives a better big-picture view of the network as multiple data points feed data into it. It should be noted, however, that some network engineers consider fog computing to be simply a Cisco brand for one approach to edge computing.

How fog computing works

Fog networking complements doesn’t replace cloud computing; fogging enables short-term analytics at the edge, while the cloud performs resource-intensive, longer-term analytics. Although edge devices and sensors are where data is generated and collected, they sometimes don’t have the compute and storage resources to perform advanced analytics and machine learning tasks. Though cloud servers have the power to do this, they are often too far away to process the data and respond in a timely manner. In addition, having all endpoints connecting to and sending raw data to the cloud over the internet can have privacy, security and legal implications, especially when dealing with sensitive data subject to regulations in different countries. Popular fog computing applications include smart grids, smart cities, smart buildings, vehicle networks and software-defined networks.

Fog computing benefits and drawbacks

Like any other technology, fog computing has its pros and cons. Some of the advantages to fog computing include the following:

Bandwidth conservation. Fog computing reduces the volume of data that is sent to the cloud, thereby reducing bandwidth consumption and related costs.

Improved response time. Because the initial data processing occurs near the data, latency is reduced, and overall responsiveness is improved. The goal is to provide millisecond-level responsiveness, enabling data to be processed in near-real time.

Network-agnostic. Although fog computing generally places compute resources at the LAN level — as opposed to the device level, which is the case with edge computing — the network could be considered part of the fog computing architecture. At the same time, though, fog computing is network-agnostic in the sense that the network can be wired, Wi-Fi or even 5G.

Of course, fog computing also has its disadvantages, some of which include the following:

Physical location. Because fog computing is tied to a physical location, it undermines some of the “anytime/anywhere” benefits associated with cloud computing.
Potential security issues. Under the right circumstances, fog computing can be subject to security issues, such as Internet Protocol (IP) address spoofing or man in the middle (MitM) attacks.
Startup costs. Fog computing is a solution that utilizes both edge and cloud resources, which means that there are associated hardware costs.
Ambiguous concept. Even though fog computing has been around for several years, there is still some ambiguity around the definition of fog computing with various vendors defining fog computing differently.

Below is a table of differences between Cloud Computing and Fog Computing:

Feature Cloud Computing Fog Computing
Latency Cloud computing has high latency compared to fog computing Fog computing has low latency
Capacity Cloud Computing does not provide any reduction in data while sending or transforming data Fog Computing reduces the amount of data sent to cloud computing.
Responsiveness Response time of the system is low. Response time of the system is high.
Security Cloud computing has less security compared to Fog Computing Fog computing has high Security.
Speed Access speed is high depending on the VM connectivity. High even more compared to Cloud Computing.
Data Integration Multiple data sources can be integrated. Multiple Data sources and devices can be integrated.
Mobility In cloud computing mobility is Limited. Mobility is supported in fog computing.
Location Awareness Partially Supported in Cloud computing. Supported in fog computing.
Number of Server Nodes Cloud computing has Few number of server nodes. Fog computing has Large number of server nodes.
Geographical Distribution It is centralized. It is decentralized and distributed.
Location of service Services provided within the internet. Services provided at the edge of the local network.
Working environment Specific data center building with air conditioning systems Outdoor (streets,base stations, etc.) or indoor (houses, cafes, etc.)
Communication mode IP network Wireless communication: WLAN, WiFi, 3G, 4G, ZigBee, etc. or wired communication (part of the IP networks)
Dependence on the quality of core network Requires strong network core. Can also work in Weak network core.
Part 10: Cloud Computing with Fog computing

Part 9: Mobile Cloud Computing with its Applications

Mobile Cloud Computing

Cloud Computing offers such smartphones that have rich Internet media support, require less processing and consume less power. In terms of Mobile Cloud Computing (MCC), processing is done in cloud, data is stored in cloud, and the mobile devices serve as media for display. Today smartphones  are employed with rich cloud services by integrating applications that consume web services. These web services are deployed in cloud. There are several Smartphone operating systems available such as Google’s Android, Apple’s iOS, RIM BlackBerry, Symbian, and Windows Mobile Phone. Each of these platforms support third-party applications that are deployed in cloud.

Architecture and Working

MCC includes four types of cloud resources:

  • Distant mobile cloud
  • Distant immobile cloud
  • Proximate mobile computing entities
  • Proximate immobile computing entities
  • Hybrid

The following diagram shows the framework for mobile cloud computing architecture:

Mobile Computing

On a remote data center, Mobile Cloud Applications are operated generally by a third-party, data is stored, and compute cycles are carried out. The uptime, integration, and security aspects are taken care of, by a backend, which also enables support to a multitude of access methods. These apps can function online quite well, however, they need timely updating. These need not be permanently stored on the device but they do not always occupy any storage space on a computer or communications device. Moreover, it offers the same experience as that of a desktop application, while offering the portability of a web application.

Issues

Despite of having significant development in field of mobile cloud computing, still many issues remain unsorted such as:

Emergency Efficient Transmission

There should be a frequent transmission of information between cloud and the mobile devices.

Architectural Issues

Mobile cloud computing is required to make architectural neutral because of heterogeneous environment.

Live VM Migration

It is challenging to migrate an application, which is resource-intensive to cloud and to execute it via Virtual Machine.

Mobile Communication Congestion

Due to continuous increase in demand for mobile cloud services, the workload to enable smooth communication between cloud and mobile devices has been increased.

Security and Privacy

This is one of the major issues because mobile users share their personal information over the cloud.

Factors Fostering Adoption Of Mobile Cloud Computing

  1. Trends and demands:
    Customers expect convenience in using companies’ websites or applications from anywhere and at any time. Mobile Cloud computing is meant for this purpose. Users always want to access business applications from anywhere, so that they can increase their productivity, even when they are on the commute.
  2. Improved and increased broadband coverage:

    3G and 4G along with WiFi, femtocells, are providing better connectivity for mobile devices cloud computing.

  3. Enabling technologies:

    HTML5, CSS3, a hypervisor for mobile devices, cloudlets and Web 4.0 are enabling technologies that will drive adoption of mobile cloud computing.

Characteristics Of Mobile Cloud Computing Application

  1. Cloud infrastructure: Cloud infrastructure is a specific form of information architecture that is used to store data.
  2. Data cache: In this, the data can be locally cached.
  3. User Accommodation: Scope of accommodating different user requirements in cloud app development is available in mobile Cloud Computing.
  4. Easy Access: It is easily accessed from desktop or mobile devices alike.
  5. Cloud Apps facilitate to provide access to a whole new range of services.

Mobile Cloud Computing Applications

There are two types of applications of mobile cloud computing (MCC) that are almost similar. These are as follows:

1. Mobile Cloud application:

It is defined as a model where processing is done in the cloud, and the storage is also in the cloud, and the presentation platform is the mobile device. For this, the internet connection should have to reliable and cell-phone to run a browser. It enables to use the smartphone with cloud technology with the following characteristics :

  • A smart-phone has a recognizable Operating System.
  • It provides advanced calling i.e. video calling and conferencing features.
  • Smart-phone must have the capability to run the installable application
    Messaging features are available.
  • A smart-phone must have a persistent and proper internet connection.

2. Mobile Web Services:

In Mobile Web Services mobile devices consume more network traffic. It may lead to some challenges for web services such as mismatch of resolution and details of desktop computers. The device needs to know about that service and the way it can be accessed to use any web-service so that the mobile device can transmit specific information about the condition of the device and the user. Enabling Mobile Web Services are as follows:

  • Enables web-service systems with web services.
  • Enables in-built external services.
  • Enable the rest protocol.
  • Enables XML-RPC protocols.
  • Enables the capabilities to authenticate user roles.
  • Benefits of Mobile Cloud Computing
  • Mobile Cloud Computing saves Business money.
  • Because of the portability which makes their work easy and efficient.
  • Cloud consumers explore more features on their mobile phones.
  • Developers reach greater markets through mobile cloud web services.
  • More network providers can join up in this field.
Part 10: Cloud Computing with Fog computing

Part 8: Cloud Computing Providers and Challenges

Cloud Providers and Challenges

Various Cloud Computing platforms are available today. The following table contains the popular Cloud Computing platforms:

SN Platform Description
1 Salesforce.com

This is a Force.com development platform. This provides a simple user interface and lets users log in, build an app, and push it in the cloud.

2 Appistry

The Appistry’s CloudIQ platform is efficient in delivering a runtime application. This platform is very useful to create scalable and service oriented applications.

3 AppScale

The AppScale is an open source platform for App Engine of Google applications.

4 AT&T

The AT&T allows access to virtual servers and manages the virtualization infrastructure. This virtualization infrastructure includes network, server and storage.

5 Engine Yard

The Engine Yard is a rails application on cloud computing platform.

6 Enomaly

Enomaly provides the Infrastructure-as-a-Service platform.

7 FlexiScale

The FlexiScale offers a cloud computing platform that allows flexible, scalable and automated cloud infrastructure.

8 GCloud3

The GCloud3 offers private cloud solution in its platform.

9 Gizmox

The Gizmox Visual WebGUI platform is best suited for developing new web apps and modernize the legacy apps based on ASP.net, DHTML, etc.

10 GoGrid

The GoGrid platform allows the users to deploy web and database cloud services.

11 Google

The Google’s App Engine lets the users build, run and maintain their applications on Google infrastructure.

12 LongJump

The LongJump offers a business application platform, a Platform-as-a-Service (PaaS).

13 Microsoft

The Microsoft Windows Azure is a cloud computing platform offering an environment to create cloud apps and services.

14 OrangeScape

OrangeScape offers a Platform-as-a-Service (Paas) for non-programmers. Building an app is as easy as spreadsheet.

15 RackSpace

The RackSpace provides servers-on-demand via a cloud-driven platform of virtualized servers.

16 Amazon EC2

The Amazon EC2 (Elastic Compute Cloud) lets the users configure and control computing resources while running them on Amazon environment.

Cloud computing, an emergent technology, has placed many challenges in different aspects of data and information handling. Some of these are shown in the following diagram:

cloud Computing Challenges

Security and Privacy

Security and Privacy of information is the biggest challenge to cloud computing. Security and privacy issues can be overcome by employing encryption, security hardware and security applications.

Portability

This is another challenge to cloud computing that applications should easily be migrated from one cloud provider to another. There must not be vendor lock-in. However, it is not yet made possible because each of the cloud provider uses different standard languages for their platforms.

Interoperability

It means the application on one platform should be able to incorporate services from the other platforms. It is made possible via web services, but developing such web services is very complex.

Computing Performance

Data intensive applications on cloud requires high network bandwidth, which results in high cost. Low bandwidth does not meet the desired computing performance of cloud application.

Reliability and Availability

It is necessary for cloud systems to be reliable and robust because most of the businesses are now becoming dependent on services provided by third-party.

Part 10: Cloud Computing with Fog computing

Part 7: Cloud Computing Security and Application

Security in cloud computing is a major concern. Data in cloud should be stored in encrypted form. To restrict client from accessing the shared data directly, proxy and brokerage services should be employed.

Security Planning

Before deploying a particular resource to cloud, one should need to analyze several aspects of the resource such as:

  • Select resource that needs to move to the cloud and analyze its sensitivity to risk.
  • Consider cloud service models such as IaaS, PaaS, and SaaS. These models require customer to be responsible for security at different levels of service.
  • Consider the cloud type to be used such as public, private, community or hybrid.
  • Understand the cloud service provider’s system about data storage and its transfer into and out of the cloud.

The risk in cloud deployment mainly depends upon the service models and cloud types.

Understanding Security of Cloud

Security Boundaries

A particular service model defines the boundary between the responsibilities of service provider and customer. Cloud Security Alliance (CSA) stack model defines the boundaries between each service model and shows how different functional units relate to each other. The following diagram shows the CSA stack model:

cloud Computing CSA Stack Model

Key Points to CSA Model

  • IaaS is the most basic level of service with PaaS and SaaS next two above levels of services.
  • Moving upwards, each of the service inherits capabilities and security concerns of the model beneath.
  • IaaS provides the infrastructure, PaaS provides platform development environment, and SaaS provides operating environment.
  • IaaS has the least level of integrated functionalities and integrated security while SaaS has the most.
  • This model describes the security boundaries at which cloud service provider’s responsibilities end and the customer’s responsibilities begin.
  • Any security mechanism below the security boundary must be built into the system and should be maintained by the customer.

Although each service model has security mechanism, the security needs also depend upon where these services are located, in private, public, hybrid or community cloud.

Understanding Data Security

Since all the data is transferred using Internet, data security is of major concern in the cloud. Here are key mechanisms for protecting data.

  • Access Control
  • Auditing
  • Authentication
  • Authorization

All of the service models should incorporate security mechanism operating in all above-mentioned areas.

Isolated Access to Data

Since data stored in cloud can be accessed from anywhere, we must have a mechanism to isolate data and protect it from client’s direct access.

Brokered Cloud Storage Access is an approach for isolating storage in the cloud. In this approach, two services are created:

  • A broker with full access to storage but no access to client.
  • A proxy with no access to storage but access to both client and broker.

Working Of Brokered Cloud Storage Access System

When the client issues request to access data:

  • The client data request goes to the external service interface of proxy.
  • The proxy forwards the request to the broker.
  • The broker requests the data from cloud storage system.
  • The cloud storage system returns the data to the broker.
  • The broker returns the data to proxy.
  • Finally the proxy sends the data to the client.

All of the above steps are shown in the following diagram:

Cloud Computing Brokered Cloud Storage Access

Encryption

Encryption helps to protect data from being compromised. It protects data that is being transferred as well as data stored in the cloud. Although encryption helps to protect data from any unauthorized access, it does not prevent data loss.


Cloud computing operation refers to delivering superior cloud service. Today, cloud computing operations have become very popular and widely employed by many of the organizations just because it allows to perform all business operations over the Internet.

These operations can be performed using a web application or mobile based applications. There are a number of operations performed in cloud. Some of them are shown in the following diagram:

Cloud Computing Operations

Managing Cloud Operations

There are several ways to manage day-to-day cloud operations, as shown in the following diagram:

Cloud Computing Operations Management

  • Always employ right tools and resources to perform any function in the cloud.
  • Things should be done at right time and at right cost.
  • Selecting an appropriate resource is mandatory for operation management.
  • The process should be standardized and automated to manage repetitive tasks.
  • Using efficient process will eliminate the waste of efforts and redundancy.
  • One should maintain the quality of service to avoid re-work later.

Cloud Computing has its applications in almost all the fields such as business, entertainment, data storage, social networking, management, entertainment, education, art and global positioning system, etc. Some of the widely famous cloud computing applications are discussed here in this tutorial:

Business Applications

Cloud computing has made businesses more collaborative and easy by incorporating various apps such as MailChimp, Chatter, Google Apps for business, and Quickbooks.

SN Application Description
1 MailChimp

It offers an e-mail publishing platform. It is widely employed by the businesses to design and send their e-mail campaigns.

2 Chatter

Chatter app helps the employee to share important information about organization in real time. One can get the instant feed regarding any issue.

3 Google Apps for Business

Google offers creating text documents, spreadsheets, presentations, etc., on Google Docs which allows the business users to share them in collaborating manner.

4 Quickbooks

It offers online accounting solutions for a business. It helps in monitoring cash flow, creating VAT returns and creating business reports.

Data Storage and Backup

Box.com, Mozy, Joukuu are the applications offering data storage and backup services in cloud.

SN Application Description
1 Box.com

Box.com offers drag and drop service for files. The users need to drop the files into Box and access from anywhere.

2 Mozy

Mozy offers online backup service for files to prevent data loss.

3 Joukuu

Joukuu is a web-based interface. It allows to display a single list of contents for files stored in Google Docs, Box.net and Dropbox.

Management Applications

There are apps available for management task such as time tracking, organizing notes. Applications performing such tasks are discussed below:

SN Application Description
1 Toggl

It helps in tracking time period assigned to a particular project.

2 Evernote

It organizes the sticky notes and even can read the text from images which helps the user to locate the notes easily.

3 Outright

It is an accounting app. It helps to track income, expenses, profits and losses in real time.

Social Applications

There are several social networking services providing websites such as Facebook, Twitter, etc.

SN Application Description
1 Facebook

It offers social networking service. One can share photos, videos, files, status and much more.

2 Twitter

It helps to interact with the public directly. One can follow any celebrity, organization and any person, who is on twitter and can have latest updates regarding the same.

Entertainment Applications

SN Application Description
1 Audio box.fm

It offers streaming service. The music files are stored online and can be played from cloud using the own media player of the service.

Art Applications

SN Application Description
1 Moo

It offers art services such as designing and printing business cards, postcards and mini cards.

Part 10: Cloud Computing with Fog computing

Part 6: Cloud Computing Management Storage and Virtualization

Cloud Management Storage and Virtualization

It is the responsibility of cloud provider to manage resources and their performance. Management of resources includes several aspects of cloud computing such as load balancing, performance, storage, backups, capacity, deployment, etc. The management is essential to access full functionality of resources in the cloud.

Cloud Management Tasks

The cloud provider performs a number of tasks to ensure efficient use of cloud resources. Here, we will discuss some of them:

Cloud Management Tasks

Audit System Backups

It is required to audit the backups timely to ensure restoring of randomly selected files of different users. Backups can be performed in following ways:

  • Backing up files by the company, from on-site computers to the disks that reside within the cloud.
  • Backing up files by the cloud provider.

Cloud Computing Management Storage and VirtualizationIt is necessary to know if cloud provider has encrypted the data, who has access to that data and if the backup is taken at different locations then the user must know the details of those locations.

Data Flow of the System

Cloud Computing Management Storage and VirtualizationThe managers are responsible to develop a diagram describing a detailed process flow. This process flow describes the movement of data belonging to an organization throughout the cloud solution.

Vendor Lock-In Awareness and Solutions

Cloud Computing Management Storage and VirtualizationThe managers must know the procedure to exit from services of a particular cloud provider. The procedures must be defined to enable the cloud managers to export data of an organization from their system to another cloud provider.

Knowing Provider’s Security Procedures

The managers should know the security plans of the provider for the following services:

  • Multitenant use
  • E-commerce processing
  • Employee screening
  • Encryption policy

Monitoring Capacity Planning and Scaling Capabilities

Cloud Computing Management Storage and Virtualization. The managers must know the capacity planning in order to ensure whether the cloud provider is meeting the future capacity requirement for his business or not. The managers must manage the scaling capabilities in order to ensure services can be scaled up or down as per the user need.

Monitor Audit Log Use

In order to identify errors in the system, managers must audit the logs on a regular basis.

Solution Testing and Validation

Cloud Computing Management Storage and VirtualizationWhen the cloud provider offers a solution, it is essential to test it in order to ensure that it gives the correct result and it is error-free. This is necessary for a system to be robust and reliable. Cloud Storage is a service that allows to save data on offsite storage system managed by third-party and is made accessible by a web services API.

Storage Devices

Storage devices can be broadly classified into two categories:

  • Block Storage Devices
  • File Storage Devices

Block Storage Devices

The block storage devices offer raw storage to the clients. These raw storage are partitioned to create volumes.

File Storage Devices

Cloud Computing Management Storage and Virtualization. The file Storage Devices offer storage to clients in the form of files, maintaining its own file system. This storage is in the form of Network Attached Storage (NAS).

Cloud Storage Classes

Cloud storage can be broadly classified into two categories:

  • Unmanaged Cloud Storage
  • Managed Cloud Storage

Unmanaged Cloud Storage

Cloud Computing Management Storage and VirtualizationUnmanaged cloud storage means the storage is preconfigured for the customer. The customer can neither format, nor install his own file system or change drive properties.

Managed Cloud Storage

Managed cloud storage offers online storage space on-demand. The managed cloud storage system appears to the user to be a raw disk that the user can partition and format.

Creating Cloud Storage System

Cloud Computing Management Storage and Virtualization. The cloud storage system stores multiple copies of data on multiple servers, at multiple locations. If one system fails, then it is required only to change the pointer to the location, where the object is stored. To aggregate the storage assets into cloud storage systems, the cloud provider can use storage virtualization software known as StorageGRID. It creates a virtualization layer that fetches storage from different storage devices into a single management system. It can also manage data from CIFS and NFS file systems over the Internet. The following diagram shows how StorageGRID virtualizes the storage into storage clouds:

Cloud Computing Data Storage

Virtual Storage Containers

The virtual storage containers offer high performance cloud storage systems. Logical Unit Number (LUN) of device, files and other objects are created in virtual storage containers. Following diagram shows a virtual storage container, defining a cloud storage domain:

Challenges

Storing the data in cloud is notVirtual Storage Containers

that simple task. Apart from its flexibility and convenience, it also has several challenges faced by the customers. The customers must be able to:

  • Get provision for additional storage on-demand.
  • Know and restrict the physical location of the stored data.
  • Verify how data was erased.
  • Have access to a documented process for disposing of data storage hardware.
  • Have administrator access control over data.


Virtualization is a technique, which allows to share single physical instance of an application or resource among multiple organizations or tenants (customers). It does so by assigning a logical name to a physical resource and providing a pointer to that physical resource on demand.

Virtualization Concept

Creating a virtual machine over existing operating system and hardware is referred as Hardware Virtualization. Virtual Machines provide an environment that is logically separated from the underlying hardware. The machine on which the virtual machine is created is known as host machine and virtual machine is referred as a guest machine. This virtual machine is managed by a software or firmware, which is known as hypervisor.

Hypervisor

The hypervisor is a firmware or low-level program that acts as a Virtual Machine Manager. There are two types of hypervisor:

Type 1 hypervisor executes on bare system. LynxSecure, RTS Hypervisor, Oracle VM, Sun xVM Server, VirtualLogic VLX are examples of Type 1 hypervisor. The following diagram shows the Type 1 hypervisor.

Type1 Hypervisor


The type1 hypervisor does not have any host operating system because they are installed on a bare system.

Type 2 hypervisor is a software interface that emulates the devices with which a system normally interacts. Containers, KVM, Microsoft Hyper V, VMWare Fusion, Virtual Server 2005 R2, Windows Virtual PC and VMWare workstation 6.0 are examples of Type 2 hypervisor. The following diagram shows the Type 2 hypervisor.

Type2 Hypervisor

Types of Hardware Virtualization

Here are the three types of hardware virtualization:

  • Full Virtualization
  • Emulation Virtualization
  • Paravirtualization

Full Virtualization

In full virtualization, the underlying hardware is completely simulated. Guest software does not require any modification to run.

Full Virtualization

Emulation Virtualization

In Emulation, the virtual machine simulates the hardware and hence becomes independent of it. In this, the guest operating system does not require modification.

Cloud Computing Emulation

Paravirtualization

In Paravirtualization, the hardware is not simulated. The guest software run their own isolated domains.

Cloud Computing Paravirtualization

VMware vSphere is highly developed infrastructure that offers a management infrastructure framework for virtualization. It virtualizes the system, storage and networking hardware.

Part 10: Cloud Computing with Fog computing

Part 5: Cloud Computing Infrastructure as IDaaS and NaaS

Cloud Infrastructure as IDaaS and NaaS

Employees in a company require to login to system to perform various tasks. These systems may be based on local server or cloud based. Following are the problems that an employee might face:

  • Remembering different username and password combinations for accessing multiple servers.
  • If an employee leaves the company, it is required to ensure that each account of that user is disabled. This increases workload on IT staff.

To solve above problems, a new technique emerged which is known as Identity-as–a-Service (IDaaS). IDaaS offers management of identity information as a digital entity. This identity can be used during electronic transactions.

Identity

Identity refers to set of attributes associated with something to make it recognizable. All objects may have same attributes, but their identities cannot be the same. A unique identity is assigned through unique identification attribute. There are several identity services that are deployed to validate services such as validating web sites, transactions, transaction participants, client, etc. Identity-as-a-Service may include the following:

  • Directory services
  • Federated services
  • Registration
  • Authentication services
  • Risk and event monitoring
  • Single sign-on services
  • Identity and profile management

Single Sign-On (SSO)

To solve the problem of using different username and password combinations for different servers, companies now employ Single Sign-On software, which allows the user to login only one time and manage the access to other systems. SSO has single authentication server, managing multiple accesses to other systems, as shown in the following diagram:

Cloud Computing Single Sign-On

SSO Working

There are several implementations of SSO. Here, we discuss the common ones:


Following steps explain the working of Single Sign-On software:

  • User logs into the
    authentication server using a username and password.

The Cloud Computing SSO Workingauthentication server returns the user’s ticket.

  • User sends the ticket to intranet server.
  • Intranet server sends the ticket to the authentication server.
  • Authentication server sends the user’s security credentials for that server back to the intranet server.

If an employee leaves the company, then disabling the user account at the authentication server prohibits the user’s access to all the systems.

Federated Identity Management (FIDM)

FIDM describes the technologies and protocols that enable a user to package security credentials across security domains. It uses Security Markup Language (SAML) to package a user’s security credentials as shown in the following diagram:

Cloud Computing FIDM

OpenID

It offers users to login into multiple websites with single account. Google, Yahoo!, Flickr, MySpace, WordPress.com are some of the companies that support OpenID.

Benefits

  • Increased site conversation rates
  • Access to greater user profile content
  • Fewer problems with lost passwords
  • Ease of content integration into social networking sites.

Network-as-a-Service

Network-as-a-Service allows us to access to network infrastructure directly and securely. NaaS makes it possible to deploy custom routing protocols. NaaS uses virtualized network infrastructure to provide network services to the customer. It is the responsibility of NaaS provider to maintain and manage the network resources. Having a provider working for a customer decreases the workload of the customer. Moreover, NaaS offers network as a utility. NaaS is also based on pay-per-use model.

How NaaS is delivered?

To use NaaS model, the customer is required to logon to the web portal, where he can get online API. Here, the customer can customize the route. In turn, customer has to pay for the capacity used. It is also possible to turn off the capacity at any time.

Mobile NaaS

Mobile NaaS offers more efficient and flexible control over mobile devices. It uses virtualization to simplify the architecture thereby creating more efficient processes. Following diagram shows the Mobile NaaS service elements:

Cloud Computing Mobile NaaS

NaaS Benefits

NaaS offers a number of benefits as discussed below:

Cloud Computing NaaS Benefits

  • Independence: Each customer is independent and can segregate the network.
  • Bursting: The customer pays for high-capacity network only on requirement.
  • Resilience: The reliability treatments are available, which can be applied for critical applications.
  • Analytics: The data protection solutions are available, which can be applied for highly sensitive applications.
  • Ease of Adding New Service Elements: It is very easy to integrate new service elements to the network.
  • Support Models: A number of support models are available to reduce operation cost.
  • Isolation of Customer Traffic: The customer traffic is logically isolated.
Part 10: Cloud Computing with Fog computing

Part 4: Cloud Computing Infrastructure as IaaS Saas Paas

Cloud Computing Infrastructure

Infrastructure-as-a-Service provides access to fundamental resources such as physical machines, virtual machines, virtual storage, etc. Apart from these resources, the IaaS also offers:

  • Virtual machine disk storage
  • Virtual local area network (VLANs)
  • Load balancers
  • IP addresses
  • Software bundles

All of the above resources are made available to end user via server virtualization. Moreover, these resources are accessed by the customers as if they own them.

Cloud Computing IaaS

Benefits

IaaS allows the cloud provider to freely locate the infrastructure over the Internet in a cost-effective manner. Some of the key benefits of IaaS are listed below:

  • Full control of the computing resources through administrative access to VMs.
  • Flexible and efficient renting of computer hardware.
  • Portability, interoperability with legacy applications.

Full control over computing resources through administrative access to VMs

IaaS allows the customer to access computing resources through administrative access to virtual machines in the following manner:

  • Customer issues administrative command to cloud provider to run the virtual machine or to save data on cloud server.
  • Customer issues administrative command to virtual machines they owned to start web server or to install new applications.

Flexible and efficient renting of computer hardware

IaaS resources such as virtual machines, storage devices, bandwidth, IP addresses, monitoring services, firewalls, etc. are made available to the customers on rent. The payment is based upon the amount of time the customer retains a resource. Also with administrative access to virtual machines, the customer can run any software, even a custom operating system.

Portability, interoperability with legacy applications

It is possible to maintain legacy between applications and workloads between IaaS clouds. For example, network applications such as web server or e-mail server that normally runs on customer-owned server hardware can also run from VMs in IaaS cloud.

Issues

IaaS shares issues with PaaS and SaaS, such as Network dependence and browser based risks. It also has some specific issues, which are mentioned in the following diagram:

Cloud Computing IaaS Issues

Compatibility with legacy security vulnerabilities

Because IaaS offers the customer to run legacy software in provider’s infrastructure, it exposes customers to all of the security vulnerabilities of such legacy software.

Virtual Machine sprawl

The VM can become out-of-date with respect to security updates because IaaS allows the customer to operate the virtual machines in running, suspended and off state. However, the provider can automatically update such VMs, but this mechanism is hard and complex.

Robustness of VM-level isolation

IaaS offers an isolated environment to individual customers through hypervisor. Hypervisor is a software layer that includes hardware support for virtualization to split a physical computer into multiple virtual machines.

Data erase practices

The customer uses virtual machines that in turn use the common disk resources provided by the cloud provider. When the customer releases the resource, the cloud provider must ensure that next customer to rent the resource does not observe data residue from previous customer.

Characteristics

Here are the characteristics of IaaS service model:

  • Virtual machines with pre-installed software.
  • Virtual machines with pre-installed operating systems such as Windows, Linux, and Solaris.
  • On-demand availability of resources.
  • Allows to store copies of particular data at different locations.
  • The computing resources can be easily scaled up and down.
  • Platform-as-a-Service offers the runtime environment for applications.
  • It also offers development and deployment tools required to develop applications. PaaS has a feature of point-and-click tools that enables non-developers to create web applications.App Engine of Google and Force.com are examples of PaaS offering vendors. Developer may log on to these websites and use the built-in API to create web-based applications.But the disadvantage of using PaaS is that, the developer locks-in with a particular vendor. For example, an application written in Python against API of Google, and using App Engine of Google is likely to work only in that environment.The following diagram shows how PaaS offers an API and development tools to the developers and how it helps the end user to access business applications.Cloud Computing PaaS

    Benefits

    Following are the benefits of PaaS model:

    Cloud Computing PaaS Benefits

    Lower administrative overhead

    Customer need not bother about the administration because it is the responsibility of cloud provider.

    Lower total cost of ownership

    Customer need not purchase expensive hardware, servers, power, and data storage.

    Scalable solutions

    It is very easy to scale the resources up or down automatically, based on their demand.

    More current system software

    It is the responsibility of the cloud provider to maintain software versions and patch installations.

    Issues

    Like SaaS, PaaS also places significant burdens on customer’s browsers to maintain reliable and secure connections to the provider’s systems. Therefore, PaaS shares many of the issues of SaaS. However, there are some specific issues associated with PaaS as shown in the following diagram:

    Cloud Computing PaaS Issues

    Lack of portability between PaaS clouds

    Although standard languages are used, yet the implementations of platform services may vary. For example, file, queue, or hash table interfaces of one platform may differ from another, making it difficult to transfer the workloads from one platform to another.

    Event based processor scheduling

    The PaaS applications are event-oriented which poses resource constraints on applications, i.e., they have to answer a request in a given interval of time.

    Security engineering of PaaS applications

    Since PaaS applications are dependent on network, they must explicitly use cryptography and manage security exposures.

    Characteristics

    Here are the characteristics of PaaS service model:

    • PaaS offers browser based development environment. It allows the developer to create database and edit the application code either via Application Programming Interface or point-and-click tools.
    • PaaS provides built-in security, scalability, and web service interfaces.
    • PaaS provides built-in tools for defining workflow, approval processes, and business rules.
    • It is easy to integrate PaaS with other applications on the same platform.
    • PaaS also provides web services interfaces that allow us to connect the applications outside the platform.

    PaaS Types

    Based on the functions, PaaS can be classified into four types as shown in the following diagram:

    Cloud Computing PaaS Types

    Stand-alone development environments

    The stand-alone PaaS works as an independent entity for a specific function. It does not include licensing or technical dependencies on specific SaaS applications.

    Application delivery-only environments

    The application delivery PaaS includes on-demand scaling and application security.

    Open platform as a service

    Open PaaS offers an open source software that helps a PaaS provider to run applications.

    Add-on development facilities

    The add-on PaaS allows to customize the existing SaaS platform.


Software-as–a-Service (SaaS) model allows to provide software application as a service to the end users. It refers to a software that is deployed on a host service and is accessible via Internet. There are several SaaS applications listed below:

  • Billing and invoicing system
  • Customer Relationship Management (CRM) applications
  • Help desk applications
  • Human Resource (HR) solutions

Some of the SaaS applications are not customizable such as Microsoft Office Suite. But SaaS provides us Application Programming Interface (API), which allows the developer to develop a customized application.

Characteristics

Here are the characteristics of SaaS service model:

  • SaaS makes the software available over the Internet.
  • The software applications are maintained by the vendor.
  • The license to the software may be subscription based or usage based. And it is billed on recurring basis.
  • SaaS applications are cost-effective since they do not require any maintenance at end user side.
  • They are available on demand.
  • They can be scaled up or down on demand.
  • They are automatically upgraded and updated.
  • SaaS offers shared data model. Therefore, multiple users can share single instance of infrastructure. It is not required to hard code the functionality for individual users.
  • All users run the same version of the software.

Benefits

Using SaaS has proved to be beneficial in terms of scalability, efficiency and performance. Some of the benefits are listed below:

  • Modest software tools
  • Efficient use of software licenses
  • Centralized management and data
  • Platform responsibilities managed by provider
  • Multitenant solutions

Modest software tools

The SaaS application deployment requires a little or no client side software installation, which results in the following benefits:

  • No requirement for complex software packages at client side
  • Little or no risk of configuration at client side
  • Low distribution cost

Efficient use of software licenses

The customer can have single license for multiple computers running at different locations which reduces the licensing cost. Also, there is no requirement for license servers because the software runs in the provider’s infrastructure.

Centralized management and data

The cloud provider stores data centrally. However, the cloud providers may store data in a decentralized manner for the sake of redundancy and reliability.

Platform responsibilities managed by providers

All platform responsibilities such as backups, system maintenance, security, hardware refresh, power management, etc. are performed by the cloud provider. The customer does not need to bother about them.

Multitenant solutions

Multitenant solutions allow multiple users to share single instance of different resources in virtual isolation. Customers can customize their application without affecting the core functionality.

Issues

There are several issues associated with SaaS, some of them are listed below:

  • Browser based risks
  • Network dependence
  • Lack of portability between SaaS clouds

Browser based risks

If the customer visits malicious website and browser becomes infected, the subsequent access to SaaS application might compromise the customer’s data. To avoid such risks, the customer can use multiple browsers and dedicate a specific browser to access SaaS applications or can use virtual desktop while accessing the SaaS applications.

Network dependence

The SaaS application can be delivered only when network is continuously available. Also network should be reliable but the network reliability cannot be guaranteed either by cloud provider or by the customer.

Lack of portability between SaaS clouds

Transferring workloads from one SaaS cloud to another is not so easy because work flow, business logics, user interfaces, support scripts can be provider specific.

Open SaaS and SOA

Open SaaS uses those SaaS applications, which are developed using open source programming language. These SaaS applications Cloud Computing SOA Implementation of SaaScan run on any open source operating system and database. Open SaaS has several benefits listed below:

  • No License Required
  • Low Deployment Cost
  • Less Vendor Lock-in
  • More portable applications
  • More Robust Solution

The following diagram shows the SaaS implementation based on SOA:

Part 10: Cloud Computing with Fog computing

Part 3: Cloud Architecture and infrastructure of different kind of Models.

Cloud Computing architecture

Cloud Computing architecture comprises of many cloud components, which are loosely coupled. We can broadly divide the cloud architecture into two parts:

  • Front End
  • Back End

Each of the ends is connected through a network, usually Internet. The following diagram shows the graphical view of cloud computing architecture:

Cloud Computing Architecture

Front End

The front end refers to the client part of cloud computing system. It consists of interfaces and applications that are required to access the cloud computing platforms, Example – Web Browser.

Back End

The back End refers to the cloud itself. It consists of all the resources required to provide cloud computing services. It comprises of huge data storage, virtual machines, security mechanism, services, deployment models, servers, etc.

Note

  • It is the responsibility of the back end to provide built-in security mechanism, traffic control and protocols.
  • The server employs certain protocols known as middleware, which help the connected devices to communicate with each other.

Cloud infrastructure consists of servers, storage devices, network, cloud management software, deployment software, and platform virtualization.

Cloud Computing Infrastructure Components


Hypervisor


Hypervisor is a firmware or low-level program that acts as a Virtual Machine Manager. It allows to share the single physical instance of cloud resources between several tenants.

Management Software: It helps to maintain and configure the infrastructure.

Deployment Software: It helps to deploy and integrate the application on the cloud.

Network:

It is the key component of cloud infrastructure. It allows to connect cloud services over the Internet. It is also possible to deliver network as a utility over the Internet, which means, the customer can customize the network route and protocol.

Server

The server helps to compute the resource sharing and offers other services such as resource allocation and de-allocation, monitoring the resources, providing security etc.

Storage

Cloud keeps multiple replicas of storage. If one of the storage resources fails, then it can be extracted from another one, which makes cloud computing more reliable.

Infrastructural Constraints

Fundamental constraints that cloud infrastructure should implement are shown in the following diagram:

Cloud Computing Infrastructure Constraints

Transparency

Virtualization is the key to share resources in cloud environment. But it is not possible to satisfy the demand with single resource or server. Therefore, there must be transparency in resources, load balancing and application, so that we can scale them on demand.

Scalability

Scaling up an application delivery solution is not that easy as scaling up an application because it involves configuration overhead or even re-architecting the network. So, application delivery solution is need to be scalable which will require the virtual infrastructure such that resource can be provisioned and de-provisioned easily.

Intelligent Monitoring

To achieve transparency and scalability, application solution delivery will need to be capable of intelligent monitoring.

Security

The mega data center in the cloud should be securely architected. Also the control node, an entry point in mega data center, also needs to be secure.

Public Cloud allows systems and services to be easily accessible to general public. The IT giants such as Google, Amazon and Microsoft offer cloud services via Internet. The Public Cloud Model is shown in the diagram below.

Public Cloud Model

Benefits

There are many benefits of deploying cloud as public cloud model. The following  shows some of those benefits:

Cost Effective

Since public cloud shares same resources with large number of customers it turns out inexpensive.

Reliability

The public cloud employs large number of resources from different locations. If any of the resources fails, public cloud can employ another one.

Flexibility

The public cloud can smoothly integrate with private cloud, which gives customers a flexible approach.

Location Independence

Public cloud services are delivered through Internet, ensuring location independence.

Utility Style Costing

Public cloud is also based on pay-per-use model and resources are accessible whenever customer needs them.

High Scalability

Cloud resources are made available on demand from a pool of resources, i.e., they can be scaled up or down according the requirement.

Disadvantages

Here are some disadvantages of public cloud model:

Low Security

In public cloud model, data is hosted off-site and resources are shared publicly, therefore does not ensure higher level of security.

Less Customizable

It is comparatively less customizable than private cloud.

Private Cloud

Private Cloud allows systems and services to be accessible within an organization. It is operated only within a single organization. However, it may be managed internally by the organization itself or by third-party. The private cloud model is shown in the diagram below.

Private Cloud Model

Benefits

There are many benefits of deploying cloud as private cloud model. The following diagram shows some of those benefits:

Private Cloud Model Benefits

High Security and Privacy

Private cloud operations are not available to general public and resources are shared from distinct pool of resources. Therefore, it ensures high security and privacy.

More Control

The private cloud has more control on its resources and hardware than public cloud because it is accessed only within an organization.

Cost and Energy Efficiency

The private cloud resources are not as cost effective as resources in public clouds but they offer more efficiency than public cloud resources.

Disadvantages

Here are the disadvantages of using private cloud model:

Restricted Area of Operation

The private cloud is only accessible locally and is very difficult to deploy globally.

High Priced

Purchasing new hardware in order to fulfill the demand is a costly transaction.

Limited Scalability

The private cloud can be scaled only within capacity of internal hosted resources.

Additional Skills

In order to maintain cloud deployment, organization requires skilled expertise.

Hybrid Cloud

Hybrid Cloud is a mixture of public and private cloud. Non-critical activities are performed using public cloud while the critical activities are performed using private cloud. The Hybrid Cloud Model is shown in the diagram below.

Hybrid Cloud Model

Benefits

There are many benefits of deploying cloud as hybrid cloud model. The following shows some of those benefits:

Scalability

It offers features of both, the public cloud scalability and the private cloud scalability.

Flexibility

It offers secure resources and scalable public resources.

Cost Efficiency

Public clouds are more cost effective than private ones. Therefore, hybrid clouds can be cost saving.

Security

The private cloud in hybrid cloud ensures higher degree of security.

Disadvantages

Networking Issues

Networking becomes complex due to presence of private and public cloud.

Security Compliance

It is necessary to ensure that cloud services are compliant with security policies of the organization.

Infrastructure Dependency

The hybrid cloud model is dependent on internal IT infrastructure, therefore it is necessary to ensure redundancy across data centers.

Community Cloud

Community Cloud is allows system and services to be accessible by group of organizations. It shares the infrastructure between several organizations from a specific community. It may be managed internally by organizations or by the third-party. The Community Cloud Model is shown in the diagram below.

Community Cloud Model

Benefits

There are many benefits of deploying cloud as community cloud model.

Cost Effective

Community cloud offers same advantages as that of private cloud at low cost.

Sharing Among Organizations

Community cloud provides an infrastructure to share cloud resources and capabilities among several organizations.

Security

The community cloud is comparatively more secure than the public cloud but less secured than the private cloud.

Issues

  • Since all data is located at one place, one must be careful in storing data in community cloud because it might be accessible to others.
  • It is also challenging to allocate responsibilities of governance, security and cost among organizations.
Part 12: Hidden Surface Removal and 3D model projection

Part 12: Hidden Surface Removal and 3D model projection

Hidden Surface Removal

  1. One of the most challenging problems in computer graphics is the removal of hidden parts from images of solid objects.
  2. In real life, the opaque material of these objects obstructs the light rays from hidden parts and prevents us from seeing them.
  3. In the computer generation, no such automatic elimination takes place when objects are projected onto the screen coordinate system.
  4. Instead, all parts of every object, including many parts that should be invisible are displayed.
  5. To remove these parts to create a more realistic image, we must apply a hidden line or hidden surface algorithm to set of objects.
  6. The algorithm operates on different kinds of scene models, generate various forms of output or cater to images of different complexities.
  7. All use some form of geometric sorting to distinguish visible parts of objects from those that are hidden.
  8. Just as alphabetical sorting is used to differentiate words near the beginning of the alphabet from those near the ends.
  9. Geometric sorting locates objects that lie near the observer and are therefore visible.
  10. Hidden line and Hidden surface algorithms capitalize on various forms of coherence to reduce the computing required to generate an image.
  11. Different types of coherence are related to different forms of order or regularity in the image.
  12. Scan line coherence arises because the display of a scan line in a raster image is usually very similar to the display of the preceding scan line.
  13. Frame coherence in a sequence of images designed to show motion recognizes that successive frames are very similar.
  14. Object coherence results from relationships between different objects or between separate parts of the same objects.
  15. A hidden surface algorithm is generally designed to exploit one or more of these coherence properties to increase efficiency.
  16. Hidden surface algorithm bears a strong resemblance to two-dimensional scan conversions.

Types of hidden surface detection algorithms

  1. Object space methods
  2. Image space methods

Object space methods:

In this method, various parts of objects are compared. After comparison visible, invisible or hardly visible surface is determined. These methods generally decide visible surface. In the wireframe model, these are used to determine a visible line. So these algorithms are line based instead of surface based. Method proceeds by determination of parts of an object whose view is obstructed by other object and draws these parts in the same color.

Image space methods:

Here positions of various pixels are determined. It is used to locate the visible surface instead of a visible line. Each point is detected for its visibility. If a point is visible, then the pixel is on, otherwise off. So the object close to the viewer that is pierced by a projector through a pixel is determined. That pixel is drawn is appropriate color. These methods are also called a Visible Surface Determination. The implementation of these methods on a computer requires a lot of processing time and processing power of the computer.

The image space method requires more computations. Each object is defined clearly. Visibility of each object surface is also determined.

Differentiate between Object space and Image space method

Object Space Image Space
1. Image space is object based. It concentrates on geometrical relation among objects in the scene. 1. It is a pixel-based method. It is concerned with the final image, what is visible within each raster pixel.
2. Here surface visibility is determined. 2. Here line visibility or point visibility is determined.
3. It is performed at the precision with which each object is defined, No resolution is considered. 3. It is performed using the resolution of the display device.
4. Calculations are not based on the resolution of the display so change of object can be easily adjusted. 4. Calculations are resolution base, so the change is difficult to adjust.
5. These were developed for vector graphics system. 5. These are developed for raster devices.
6. Object-based algorithms operate on continuous object data. 6. These operate on object data.
7. Vector display used for object method has large address space. 7. Raster systems used for image space methods have limited address space.
8. Object precision is used for application where speed is required. 8. There are suitable for application where accuracy is required.
9. It requires a lot of calculations if the image is to enlarge. 9. Image can be enlarged without losing accuracy.
10. If the number of objects in the scene increases, computation time also increases. 10. In this method complexity increase with the complexity of visible parts.

Similarity of object and Image space method

In both method sorting is used a depth comparison of individual lines, surfaces are objected to their distances from the view plane.

Hidden Surface RemovalHidden Surface Removal

Considerations for selecting or designing hidden surface algorithms: Following three considerations are taken:

  1. Sorting
  2. Coherence
  3. Machine

Sorting: All surfaces are sorted in two classes, i.e., visible and invisible. Pixels are colored accordingly. Several sorting algorithms are available i.e.

  1. Bubble sort
  2. Shell sort
  3. Quick sort
  4. Tree sort
  5. Radix sort

Different sorting algorithms are applied to different hidden surface algorithms. Sorting of objects is done using x and y, z co-ordinates. Mostly z coordinate is used for sorting. The efficiency of sorting algorithm affects the hidden surface removal algorithm. For sorting complex scenes or hundreds of polygons complex sorts are used, i.e., quick sort, tree sort, radix sort. For simple objects selection, insertion, bubble sort is used.

Coherence

It is used to take advantage of the constant value of the surface of the scene. It is based on how much regularity exists in the scene. When we moved from one polygon of one object to another polygon of same object color and shearing will remain unchanged.

Types of Coherence

  1. Edge coherence
  2. Object coherence
  3. Face coherence
  4. Area coherence
  5. Depth coherence
  6. Scan line coherence
  7. Frame coherence
  8. Implied edge coherence

1. Edge coherence: The visibility of edge changes when it crosses another edge or it also penetrates a visible edge.

2. Object coherence: Each object is considered separate from others. In object, coherence comparison is done using an object instead of edge or vertex. If A object is farther from object B, then there is no need to compare edges and faces.
3. Face coherence: In this faces or polygons which are generally small compared with the size of the image.

4. Area coherence: It is used to group of pixels cover by same visible face.

5. Depth coherence: Location of various polygons has separated a basis of depth. Depth of surface at one point is calculated, the depth of points on rest of the surface can often be determined by a simple difference equation.

6. Scan line coherence: The object is scanned using one scan line then using the second scan line. The intercept of the first line.

7. Frame coherence: It is used for animated objects. It is used when there is little change in image from one frame to another.

8. Implied edge coherence: If a face penetrates in another, line of intersection can be determined from two points of intersection.

Algorithms used for hidden line surface detection

  1. Back Face Removal Algorithm
  2. Z-Buffer Algorithm
  3. Painter Algorithm
  4. Scan Line Algorithm
  5. Subdivision Algorithm
  6. Floating horizon Algorithm

3D Modelling System

It is a 2D modeling system plus the addition of some more extra primitives. 3D system includes all types of user-defined systems. The standard coordinate system used is called a world coordinate system. Whereas the user-defined coordinate system is called a user coordinate system.

It is of three types

    1. Solid Modelling System3D Modelling System


  1. Surface Modelling System
  2. Wireframe Models


Wireframe Models:
 It has a lot of other names also i.e.

  1. Edge vertex models
  2. Stick figure model
  3. Polygonal net
  4. Polygonal mesh
  5. Visible line detection method

Wireframe model consists of vertex, edge (line) and polygons. Edge is used to join vertex. Polygon is a combination of edges and vertices. The edges can be straight or curved. This model is used to define computer models of parts, especially for computer-assisted drafting systems. Wireframe models are Skelton of lines. Each line has two endpoints. The visibility or appearance or look of the surface can be should using wireframe. If any hidden section exists that will be removed or represented using dashed lines. For determining hidden surface, hidden lines methods or visible line methods are used.

Advantage

  1. It is simple and easy to create.
  2. It requires little computer time for creation.
  3. It requires a short computer memory, so the cost is reduced.
  4. Wireframe provides accurate information about deficiencies of the surface.
  5. It is suitable for engineering models composed of straight lines.
  6. The clipping process in the wireframe model is also easy.
  7. For realistic models having curved objects, roundness, smoothness is achieved.

Disadvantage

  1. It is given only information about the outlook if do not give any information about the complex part.
  2. Due to the use of lines, the shape of the object lost in cluttering of lines.
  3. Each straight line will be represented as collections of four fold lines using data points. So complexity will be increased.

Projection

It is the process of converting a 3D object into a 2D object. It is also defined as mapping or transformation of the object in projection plane or view plane. The view plane is displayed surface.

Projection

Part 12: Hidden Surface Removal and 3D model projection

Part 11: Three Dimensional Graphics on Computer Graphics

Three Dimensional Graphics

The 2D can show two-dimensional objects. Like the Bar chart, pie chart, graphs. But some more natural objects can be represented using 3D. Using 3D, we can see different shapes of the object in different sections. In 3D when a translation is done we need three factors for rotation also, it is a component of three rotations. Each can be performed along any three Cartesian axis. In 3D also we can represent a sequence of transformations as a single matrix. Computer Graphics uses CAD. CAD allows manipulation of machine components which are 3 Dimensional. It also provides automobile bodies, aircraft parts study. All these activities require realism. For realism 3D is required. In the production of a realistic 3D scene from 2D is tough. It require three dimension, i.e., depth.

3D Geometry

Three dimension system has three axis x, y, z. The orientation of a 3D coordinate system is of two types. Right-handed system and left-handed system. In the right -handed system thumb of right- hand points to positive z-direction and left- hand system thumb point to negative two directions. Following figure show right-hand orientation of the cube.

Three Dimensional Graphics

Using right-handed system co-ordinates of corners A, B, C, D of the cube

Point A         x, y, z
Point B         x, y, 0
Point C         0, y, 0
Point D         0, y, z

Producing realism in 3D:

The three-dimensional objects are made using computer graphics. The technique used for two Dimensional displays of three Dimensional objects is called projection. Several types of projection are available, i.e.,

  1. Parallel Projection
  2. Perspective Projection
  3. Orthographic Projection

1. Parallel Projection:

 In this projection point on the screen is identified within a point in the three-dimensional object by a line perpendicular to the display screen. The architect Drawing, i.e., plan, front view, side view, elevation are nothing but lines of parallel projections.

2. Perspective Projection:

This projection has a property that it provides idea about depth. Farther the object from the viewer, smaller it will appear. All lines in perspective projection converge at a center point called as the center of projection.

3. Orthographic Projection: It is simplest kind of projection. In this, we take a top, bottom, side view of the object by extracting parallel lines from the object.

Three Dimensional Models

The techniques for generating different images of a solid object depend upon the type of object. Two viewing techniques are available for viewing three-dimensional objects.

  1. Geometry: It is concerned with measurements. Measurement is the location of a point concerning origin or dimension of an object.
  2. Topological Information: It is used for the structure of a solid object. It is mainly concerned with the formation of polygons with the help of points of objects or the creation of the object with polygons.

Three Dimensional Transformations

The geometric transformations play a vital role in generating images of three Dimensional objects with the help of these transformations. The location of objects relative to others can be easily expressed. Sometimes viewpoint changes rapidly, or sometimes objects move in relation to each other. For this number of transformation can be carried out repeatedly.

Translation

It is the movement of an object from one position to another position. Translation is done using translation vectors. There are three vectors in 3D instead of two. These vectors are in x, y, and z directions. Translation in the x-direction is represented using Tx. The translation is y-direction is represented using Ty. The translation in the z- direction is represented using Tz.

If P is a point having co-ordinates in three directions (x, y, z) is translated, then after translation its coordinates will be (x1 y1 z1) after translation. Tx Ty Tz are translation vectors in x, y, and z directions respectively.

x1=x+ Tx
y1=y+Ty
z1=z+ Tz

Three-dimensional transformations are performed by transforming each vertex of the object. If an object has five corners, then the translation will be accomplished by translating all five points to new locations. Following figure 1 shows the translation of point figure 2 shows the translation of the cube.

Three Dimensional TransformationsThree Dimensional Transformations

Matrix for translation

Three Dimensional Transformations

Matrix representation of point translation

Point shown in fig is (x, y, z). It become (x1,y1,z1) after translation. Tx Ty Tz are translation vector.

Three Dimensional Transformations

Example:

A point has coordinates in the x, y, z direction i.e., (5, 6, 7). The translation is done in the x-direction by 3 coordinate and y direction. Three coordinates and in the z- direction by two coordinates. Shift the object. Find coordinates of the new position.

Solution: Co-ordinate of the point are (5, 6, 7)
Translation vector in x direction = 3
Translation vector in y direction = 3
Translation vector in z direction = 2
Translation matrix is
Three Dimensional Transformations

Multiply co-ordinates of point with translation matrix

Three Dimensional Transformations

= [5+0+0+30+6+0+30+0+7+20+0+0+1] = [8991]

x becomes x1=8
y becomes y1=9
z becomes z1=9

Scaling

Scaling is used to change the size of an object. The size can be increased or decreased. The scaling three factors are required Sx Sy and Sz.

Sx=Scaling factor in x- direction
Sy=Scaling factor in y-direction
Sz=Scaling factor in z-direction

Scaling

Matrix for Scaling

Scaling

Scaling of the object relative to a fixed point

Following are steps performed when scaling of objects with fixed point (a, b, c). It can be represented as below:

  1. Translate fixed point to the origin
  2. Scale the object relative to the origin
  3. Translate object back to its original position.

In figure (a) point (a, b, c) is shown, and object whose scaling is to done also shown in steps in fig (b), fig (c) and fig (d).

ScalingScaling
ScalingScaling

Scaling

Scaling is used to change the size of an object. The size can be increased or decreased. The scaling three factors are required Sx Sy and Sz.

Sx=Scaling factor in x- direction
Sy=Scaling factor in y-direction
Sz=Scaling factor in z-direction

Scaling

Matrix for Scaling

Scaling

Scaling of the object relative to a fixed point

Following are steps performed when scaling of objects with fixed point (a, b, c). It can be represented as below:

  1. Translate fixed point to the origin
  2. Scale the object relative to the origin
  3. Translate object back to its original position.

In figure (a) point (a, b, c) is shown, and object whose scaling is to done also shown in steps in fig (b), fig (c) and fig (d).

ScalingScaling
ScalingScaling

Inverse Transformations

These are also called as opposite transformations. If T is a translation matrix than inverse translation is representing using T-1. The inverse matrix is achieved using the opposite sign.

Example1: Translation and its inverse matrix

Translation matrix

Inverse Transformations

Inverse translation matrix

Inverse Transformations

Example2: Rotation and its inverse matrix

Inverse Transformations

Inverse Rotation Matrix

Inverse Transformations

Reflection

It is also called a mirror image of an object. For this reflection axis and reflection of plane is selected. Three-dimensional reflections are similar to two dimensions. Reflection is 180° about the given axis. For reflection, plane is selected (xy,xz or yz). Following matrices show reflection respect to all these three planes.

Reflection relative to XY plane

Reflection
Reflection

Reflection relative to YZ plane

Reflection

Reflection relative to ZX plane

Reflection

Shearing

It is change in the shape of the object. It is also called as deformation. Change can be in the x -direction or y -direction or both directions in case of 2D. If shear occurs in both directions, the object will be distorted. But in 3D shear can occur in three directions.

Matrix for shear

Shearing
ShearingShearing
Shearing

Part 12: Hidden Surface Removal and 3D model projection

Part 10: Pointing Positioning and Animation Techniques

Pointing and Positioning Techniques

Pointing technique refers to look at the items already on the screen whereas the positioning technique refers to position the item on the screen to a new position, i.e., the old current position. The user indicates a position on the screen with an input device, and this position is used to insert a symbol.

There are various pointing and positioning devices which are discussed below:

  1. Light Pen
  2. Mouse
  3. Tablet
  4. Joystick
  5. Trackball and spaceball

1. Light Pen:

It is a pointing device. When light pen is pointed at an item on the screen, it generates information from which the item can be identified by the program. It does not have any associated tracking hardware instead tracking is performed by software, making use of the output function of the display. All light pen programs depend on a rapid response from the pen when it is pointed at the screen fast response light pens can be build by using a highly sensitive photocell such as a photomultiplier tube.

2. Mouse:

It is a positioning device which consists of a small plastic box resting on two metal wheels whose axes are at right angles. Each wheel of the mouse is linked to a shaft encoder that delivers an electrical pulse for every incremental rotation of the wheel. As the mouse is rolled around on a flat surface, its movement in two orthogonal directions is translated into rotation of the wheels. These rotations can be measured by counting the pulses received from the shaft encoders. The connected values may be held in registers accessible to the computer on written directly into the computer memory. It is simple and low cost, and there is no need to pick it up to use it. The mouse sits on the table surface. But the mouse cannot be used for tracing data from paper since a small rotation of the mouse will cause an error in all the reading and it is complicated handprint character for recognition by the computer.

3. Tablet: It is also a positioning device and is used to describe a flat surface separate from the display, on which the user draws with a stylus. There are two types of tablets:

  1. Acoustic Tablet:

    It depends on the use of strip microphones which are mounted along two adjacent edges of the tablet. The styles have a small piece of ceramic mounted close to its tip, and at regular intervals, a small spark is generated across the surface of the ceramic between two electrodes. The microphones pick up the pulse of sound produced by the spark and two counters record the delay between creating the spark and receiving the sound. These two delays are proportional to the stylus distance from the two edges of the tablet where the microphones are mounted.

  2. Electro-acoustic Tablet:

    In this technique, the writing surface is a sheet of magneto strictive material acting as a row of delay lines. An electric pulse travels through the sheet first horizontally and then vertically and is detected by a sensor in the stylus. A counter is used to determine the delay from the time the pulse is issued to the time it is detected; from this value, the position of the stylus can be determined. The electro-acoustic tablet is quieter in operation than its acoustic counterpart and is less affected by noise or air movement.

4. Joystick:

A joystick consists of a small that is used to steer the screen cursor around. The distance that the stick is moved in any direction from its center position corresponds to the screen-cursor movement in that direction. Pressure sensitive joysticks have a non-moveable stick. Pressure on the stick is measured with strain gauges and converted to the movement of the cursor in the direction specified.

5. Trackball and spaceball:

Trackball is a ball that can be rotated with the fingers to produces screen-cursor movement potentiometers, attached to the ball, measure the amount and direction of rotation. Trackballs are after mounted on keyboards, whereas space-ball provides six degrees of freedom. Spaceballs is used for three-dimensional positioning and selection operation in virtual reality system, modeling, animation, CAD and other applications.

Elastic or Rubber Band Techniques

  • Rubber banding is a popular technique of drawing geometric primitives such as line, polylines, rectangle, circle and ellipse on the computer screen.
  • It becomes an integral part and de facto standard with the graphical user interface (GUI) for drawing and is almost universally accepted by all windows based applications.
  • The user specifies the line in the usual way by positioning its two endpoints. As we move from the first endpoint to the second, the program displays a line from the first endpoint to the cursor position, thus he can see the lie of the line before he finishes positioning it.
  • The effect is of an elastic line stretched between the first endpoint and the cursor; hence the name for these techniques.

Consider the different linear structures in fig (a) and fig (d), depending on the position of the cross-hair cursor. The user may move the cursor to generate more possibilities and select the one which suits him for a specific application.

Elastic or Rubber Band Techniques

Selection of Terminal Point of the Line:

  • The user moves the cursor to the appropriate position and selects.
  • Then, as the cursor is moved, the line changes taking the latest positions of the cursors as the end-point.
  • As long as the button is held down, the state of the rubber band is active.

The process is explained with the state transition diagram of rubber banding in fig:

Elastic or Rubber Band Techniques

When the user is happy with the final position, the pressed button is released, and the line is drawn between the start and the last position of the cursor.

Example: This is widely followed in MS-Window based Applications like in the case of a paintbrush drawing package.

Other geometric entities can be drawn in a rubber-band fashion:

  • Horizontally or vertically constructed lines
  • Rectangles
  • Arcs of circles

This technique is very helpful in drawing relatively complex entities such as rectangles and arcs.

Elastic or Rubber Band Techniques

Advantage:

  1. It is used for drawing all geometric entities such as line, polygon, circle, rectangle, ellipse, and other curves.
  2. It is easy to understand and implement.

Disadvantage:

  1. It requires computational resources like software and CPU speed.
  2. Expensive

Dragging

Dragging is used to move an object from one position to another position on the computer screen. To drag any other object, first, we have to select the object that we want to move on the screen by holding the mouse button down. As cursor moved on the screen, the object is also moved with the cursor position. When the cursor reached the desired position, the button is released.

The following diagram represents the dragging procedure:

Dragging
Dragging

Animation

Animation refers to the movement on the screen of the display device created by displaying a sequence of still images. Animation is the technique of designing, drawing, making layouts and preparation of photographic series which are integrated into the multimedia and gaming products. Animation connects the exploitation and management of still images to generate the illusion of movement. A person who creates animations is called animator. He/she use various computer technologies to capture the pictures and then to animate these in the desired sequence. Animation includes all the visual changes on the screen of display devices. These are:

1. Change of shape as smile, sad and angry etc emoticon.

2. Change in size as very small circle, larger circle and biggest circle etc.
3. Change in color select red unselect white.

4. Change in structure as rotate a triangle.

5. Change in angle as counter clockwise and antilock wise:

Application Areas of Animation

1. Education and Training:

Animation is used in school, colleges and training centers for education purpose. Flight simulators for aircraft are also animation based.

2. Entertainment:

 Animation methods are now commonly used in making motion pictures, music videos and television shows, etc.

3. Computer Aided Design (CAD):

One of the best applications of computer animation is Computer Aided Design and is generally referred to as CAD. One of the earlier applications of CAD was automobile designing. But now almost all types of designing are done by using CAD application, and without animation, all these work can’t be possible.

4. Advertising:

This is one of the significant applications of computer animation. The most important advantage of an animated advertisement is that it takes very less space and capture people attention.

5. Presentation:

Animated Presentation is the most effective way to represent an idea. It is used to describe financial, statistical, mathematical, scientific & economic data.

Animation Functions

1. Morphing:

Morphing is an animation function which is used to transform object shape from one form to another is called Morphing. It is one of the most complicated transformations. This function is commonly used in movies, cartoons, advertisement, and computer games. Example: Face App make one younger image into older.

The process of Morphing involves three steps:

  1. In the first step, one initial image and other final image are added to morphing application as shown in fig: Ist & 4th object consider as key frames.
  2. The second step involves the selection of key points on both the images for a smooth transition between two images as shown in 2nd object.

Animation Functions

3. In the third step, the key point of the first image transforms to a corresponding key point of the second image as shown in 3rd object of the figure.

2. Wrapping:

Wrapping function is similar to morphing function. It distorts only the initial images so that it matches with final images and no fade occurs in this function.
3. Tweening:

Tweening is the short form of ‘inbetweening.’ Tweening is the process of generating intermediate frames between the initial & last final images. This function is popular in the film industry.

Animation Functions

4. Panning:

Usually Panning refers to rotation of the camera in horizontal Plane. In computer graphics, Panning relates to the movement of fixed size window across the window object in a scene. In which direction the fixed sized window moves, the object appears to move in the opposite direction as human walk but the moon in fix plane but seem to us moving with us. Another example running car and rain.

If the window moves in a backward direction, then the object appear to move in the forward direction and the window moves in forward direction then the object appear to move in a backward direction.

5. Zooming:

In zooming, the window is fixed an object and change its size, the object also appear to change in size. When the window is made smaller about a fixed center, the object comes inside the window appear more enlarged. This feature is known as Zooming In.

When we increase the size of the window about the fixed center, the object comes inside the window appear small. This feature is known as Zooming Out.

6. Fractals:

Fractal Function is used to generate a complex picture by using Iteration. Iteration means the repetition of a single formula again & again with slightly different value based on the previous iteration result. These results are displayed on the screen in the form of the display picture.

Part 12: Hidden Surface Removal and 3D model projection

Part 9: Clipping and Polygon various Technique algorithm

Clipping:

When we have to display a large portion of the picture, then not only scaling & translation is necessary, the visible part of picture is also identified. This process is not easy. Certain parts of the image are inside, while others are partially inside. The lines or elements which are partially visible will be omitted. For deciding the visible and invisible portion, a particular process called clipping is used. Clipping determines each element into the visible and invisible portion. Visible portion is selected. An invisible portion is discarded.

Types of Lines:

Lines are of three types:

  1. Visible: A line or lines entirely inside the window is considered visible
  2. Invisible: A line entirely outside the window is considered invisible
  3. Clipped: A line partially inside the window and partially outside is clipped. For clipping point of intersection of a line with the window is determined.

Clipping

Clipping can be applied through hardware as well as software. In some computers, hardware devices automatically do work of clipping. In a system where hardware clipping is not available software clipping applied.

Following figure show before and after clipping

Clipping

The window against which object is clipped called a clip window. It can be curved or rectangle in shape.

Applications of clipping:

  1. It will extract part we desire.
  2. For identifying the visible and invisible area in the 3D object.
  3. For creating objects using solid modeling.
  4. For drawing operations.
  5. Operations related to the pointing of an object.
  6. For deleting, copying, moving part of an object.

Clipping can be applied to world co-ordinates. The contents inside the window will be mapped to device co-ordinates. Another alternative is a complete world co-ordinates picture is assigned to device co-ordinates, and then clipping of viewport boundaries is done.

Types of Clipping:

  1. Point Clipping
  2. Line Clipping
  3. Area Clipping (Polygon)
  4. Curve Clipping
  5. Text Clipping
  6. Exterior Clipping

Point Clipping:

Point Clipping is used to determining, whether the point is inside the window or not. For this following conditions are checked.

  1. x ≤ xmax
  2. x ≥ xmin
  3. y ≤ ymax
  4. y ≥ ymin

Point Clipping

The (x, y) is coordinate of the point. If anyone from the above inequalities is false, then the point will fall outside the window and will not be considered to be visible.

Program1:

To implement Point Clipping:

  1. #include<stdio.h>
  2. #include<conio.h>
  3. #include<graphics.h>
  4. inttlx,tly,brx,bry,px,py;
  5. void point_clip()
  6. {
  7. intwxmin,wymin,wxmax,wymax;
  8. wxmin=tlx;
  9. wxmax=brx;
  10. wymin=tly;
  11. wymax=bry;
  12. if(px>=wxmin&&px<=wxmax)
  13. if(py>=wymin&&py<=wymax)
  14. putpixel(px,py,RED);
  15. getch();
  16. closegraph();
  17. }
  18. void main()
  19. {
  20. intgd=DETECT,gm,xc,yc,r;
  21. clrscr();
  22. printf(“Enter the top left coordinate”);
  23. scanf(“%d%d”,&tlx,&tly);
  24. printf(“Enter the bottom right coordinate”);
  25. scanf(“%d%d”,&brx,&bry);
  26. printf(“\n Enter the point”);
  27. scanf(“%d%d”,&px,&py);
  28. initgraph(&gd,&gm,“c:\\tc\\bgi”);
  29. setbkcolor(BLUE);
  30. setcolor(RED);
  31. rectangle(tlx,tly,brx,bry);
  32. point_clip();
  33. }

Output:

Point Clipping
Point Clipping

Line Clipping:

It is performed by using the line clipping algorithm. The line clipping algorithms are:

  1. Cohen Sutherland Line Clipping Algorithm
  2. Midpoint Subdivision Line Clipping Algorithm
  3. Liang-Barsky Line Clipping Algorithm

Cohen Sutherland Line Clipping Algorithm:

In the algorithm, first of all, it is detected whether line lies inside the screen or it is outside the screen. All lines come under any one of the following categories:

  1. Visible
  2. Not Visible
  3. Clipping Case

1. Visible: If a line lies within the window, i.e., both endpoints of the line lies within the window. A line is visible and will be displayed as it is.

2. Not Visible: If a line lies outside the window it will be invisible and rejected. Such lines will not display. If any one of the following inequalities is satisfied, then the line is considered invisible. Let A (x1,y2) and B (x2,y2) are endpoints of line.
3. Clipping Case: If the line is neither visible case nor invisible case. It is considered to be clipped case. First of all, the category of a line is found based on nine regions given below. All nine regions are assigned codes. Each code is of 4 bits. If both endpoints of the line have end bits zero, then the line is considered to be visible.

Line Clipping

The center area is having the code, 0000, i.e., region 5 is considered a rectangle window.

Following figure show lines of various types

Line Clipping

Line AB is the visible case
Line OP is an invisible case
Line PQ is an invisible line
Line IJ are clipping candidates
Line MN are clipping candidate
Line CD are clipping candidate

Advantage of Cohen Sutherland Line Clipping:

  1. It calculates end-points very quickly and rejects and accepts lines quickly.
  2. It can clip pictures much large than screen size.

Algorithm of Cohen Sutherland Line Clipping:

Step1:Calculate positions of both endpoints of the line

Step2:Perform OR operation on both of these end-points

Step3:If the OR operation gives 0000
Then
line is considered to be visible
else
Perform AND operation on both endpoints
If And ≠ 0000
then the line is invisible
else
And=0000
Line is considered the clipped case.

Step4:If a line is clipped case, find an intersection with boundaries of the window
m=(y2-y1 )(x2-x1)

(a) If bit 1 is “1” line intersects with left boundary of rectangle window
y3=y1+m(x-X1)
where X = Xwmin
where Xwminis the minimum value of X co-ordinate of window

(b) If bit 2 is “1” line intersect with right boundary
y3=y1+m(X-X1)
where X = Xwmax
where X more is maximum value of X co-ordinate of the window

(c) If bit 3 is “1” line intersects with bottom boundary
X3=X1+(y-y1)/m
where y = ywmin
ywmin is the minimum value of Y co-ordinate of the window

(d) If bit 4 is “1” line intersects with the top boundary
X3=X1+(y-y1)/m
where y = ywmax
ywmax is the maximum value of Y co-ordinate of the window

Example of Cohen-Sutherland Line Clipping Algorithm:

Let R be the rectangular window whose lower left-hand corner is at L (-3, 1) and upper right-hand corner is at R (2, 6). Find the region codes for the endpoints in fig:

Line Clipping

The region code for point (x, y) is set according to the scheme
Bit 1 = sign (y-ymax)=sign (y-6)         Bit 3 = sign (x-xmax)= sign (x-2)
Bit 2 = sign (ymin-y)=sign(1-y)         Bit 4 = sign (xmin-x)=sign(-3-x)

Here

Line Clipping

So

A (-4, 2)→ 0001         F (1, 2)→ 0000
B (-1, 7) → 1000         G (1, -2) →0100
C (-1, 5)→ 0000         H (3, 3) → 0100
D (3, 8) → 1010         I (-4, 7) → 1001
E (-2, 3) → 0000         J (-2, 10) → 1000

We place the line segments in their appropriate categories by testing the region codes found in the problem.

Category1 (visible): EF since the region code for both endpoints is 0000.

Category2 (not visible): IJ since (1001) AND (1000) =1000 (which is not 0000).

Category 3 (candidate for clipping): AB since (0001) AND (1000) = 0000, CD since (0000) AND (1010) =0000, and GH. since (0100) AND (0010) =0000.

The candidates for clipping are AB, CD, and GH.

In clipping AB, the code for A is 0001. To push the 1 to 0, we clip against the boundary line xmin=-3. The resulting

intersection point is I1 (-3,3Line Clipping). We clip (do not display) AI1 and I1 B. The code for I1is 1001. The clipping category for I1 B is 3 since (0000) AND (1000) is (0000). Now B is outside the window (i.e., its code is 1000), so we push the 1

to a 0 by clipping against the line ymax=6. The resulting intersection is l2 (-1Line Clipping,6). Thus I2 B is clipped. The code for I2 is 0000. The remaining segment I1 I2 is displayed since both endpoints lie in the window (i.e., their codes are 0000).

For clipping CD, we start with D since it is outside the window. Its code is 1010. We push the first 1 to a 0 by clipping against the line ymax=6. The resulting intersection I3 is (Line Clipping,6),and its code is 0000. Thus I3 D is clipped and the remaining segment CI3 has both endpoints coded 0000 and so it is displayed.

For clipping GH, we can start with either G or H since both are outside the window. The code for G is 0100, and we push the 1 to a 0 by clipping against the line ymin=1.The resulting intersection point is I4 (2Line Clipping,1) and its code is 0010. We clip GI4 and work on I4 H. Segment I4 H is not displaying since (0010) AND (0010) =0010.

Program to perform Line Clipping using Cohen Sutherland Algorithm:

  1. #include <iostream.h>
    #include <conio.h>
    #include <graphics.h>
    #include <dos.h>
    class data
    {
        int gd, gmode, x, y, xmin,ymin,ymax,xmax;
        int a1,a2;
        float x1, y1,x2,y2,x3,y3;
        int xs, ys, xe, ye;
        float maxx,maxy;
        public:
            void getdata ();
            void find ();
            void clip ();
            void display (float, float,float,float);
            void checkonof (int);
            void showbit (int);
    };
    void data :: getdata ()
    {
        cout<<"Enter the minimum and maximum coordinate of window (x, y) ";
               cin >>xmin>>ymin>>xmax>>ymax;
               cout<<"Enter the end points of the line to be clipped";
               cin >>xs>>ys>>xe>>ye;
               display (xs, ys, xe,ye);
    }
    void data :: display (float, xs, float, ys,float xe, float ye)
    {
        int gd=DETECT;
        initgraph (&gd,&gmode, "");
        maxx=getmaxx();
        maxy=getmaxy();
        line (maxx/2,0,maxx/2,maxy);
        line (0, maxy/2,maxx,maxy/2);
        rectangle (maxx/2+xmin,maxy/2-ymax,maxx/2+xmax,maxy/2-ymin);
        line (maxx/2+xs,maxy/2-ys,maxx/2+xe,maxy/2-ye);
        getch();
    }
    void data :: find ()
    {
        a1=0;
        a2=0;
        if ((ys-ymax)>0)
                   a1+=8;
        if ((ymin-ys)>0)
            a1+=4;
        if ((xs-xmax)>0)
             a1+=2;
                if ((xmin-xs)>0)
             a1+=1;
         if ((ye-ymax)>0)
            a2+=8;
               if ((ymin-ye)>0)
                  a2+=4;
              if ((xe-xmax)>0)
                   a2+=2;
              if ((xmin-xe)>0)
                    a2+=1;
             cout<<"\nThe area code of Ist point is ";
                     showbit (a1);
             getch ();
             cout <<"\nThe area code of 2nd point is ";
             showbit (a2);
             getch ();
    }
    void data :: showbit (int n)
    {
            int i,k, and;
            for (i=3;i>=0;i--)
            {
                  and =1<<i;
           k = n?
           k ==0?cout<<"0": cout<<"1\"";
              }
    }
    void data ::clip()
    {
             int j=a1&a2;
             if (j==0)
             {
                  cout<<"\nLine is perfect candidate for clipping";
                  if (a1==0)
           {
                        else
                 {
                       checkonof(a1);
                       x2=x1;y2=y1;
                 }
                 if (a2=0)
                {
                     x3=xe; y3=ye;
                }
               else
               {
                       checkonof (a2);
                       x3=x1; y3=y1;
                }
                xs=x2; ys=y2;xe=x3;ye=y3;
                cout << endl;
                display (xs,ys,xe,ye);
                cout<<"Line after clipping";
                getch ()
              }
           else if ((a1==0) && (a2=0))
           {
                   cout <<"\n Line is in the visible region";
                   getch ();
           }
    }
    void data :: checkonof (int i)
    {
          int j, k,l,m;
          1=i&1;
          x1=0;y1=0;
           if (1==1)
          {
                 x1=xmin;
                 y1=ys+ ((x1-xs)/ (xe-xs))*(ye-ys);
          }
          j=i&8;
       if (j>0)
       {
                 y1=ymax;
          x1=xs+(y1-ys)/(ye-ys))*(xe-xs);
        }
        k=i & 4;
        if (k==1)
        {
               y1=ymin;
               x1=xs+((y1-ys)/(ye-ys))*(xe-xs);
        }
        m= i&2;
         if (m==1)
         {
                x1=xmax;
                y1=ys+ ((x1-xs)/ (xe-xs))*(ye-ys);
          }
          main ()
          {
                 data s;
                 clrscr();
                 s.getdata();
                 s.find();
                 getch();
                 closegraph ();
                 return ();
        }


Output:

Line Clipping

Mid Point Subdivision Line Clipping Algorithm:

It is used for clipping line. The line is divided in two parts. Mid points of line is obtained by dividing it in two short segments. Again division is done, by finding midpoint. This process is continued until line of visible and invisible category is obtained. Let (xi,yi) are midpoint

Mid Point Subdivision Line Clipping Algorithm

x5lie on point of intersection of boundary of window.

Advantage of midpoint subdivision Line Clipping:

It is suitable for machines in which multiplication and division operation is not possible. Because it can be performed by introducing clipping divides in hardware.

Algorithm of midpoint subdivision Line Clipping:

Step1: Calculate the position of both endpoints of the line

Step2: Perform OR operation on both of these endpoints

Step3: If the OR operation gives 0000
then
Line is guaranteed to be visible
else
Perform AND operation on both endpoints.
If AND ≠ 0000
then the line is invisible
else
AND=6000
then the line is clipped case.

Step4: For the line to be clipped. Find midpoint
Xm=(x1+x2)/2
Ym=(y1+y2)/2
Xmis midpoint of X coordinate.
Ymis midpoint of Y coordinate.

Step5: Check each midpoint, whether it nearest to the boundary of a window or not.

Step6: If the line is totally visible or totally rejected not found then repeat step 1 to 5.

Step7: Stop algorithm.

Example: Window size is (-3, 1) to (2, 6). A line AB is given having co-ordinates of A (-4, 2) and B (-1, 7). Does this line visible. Find the visible portion of the line using midpoint subdivision?

Solution:

Step1: Fix point A (-4, 2)

Mid Point Subdivision Line Clipping Algorithm

Step2: Find b”=mid of b’and b

Mid Point Subdivision Line Clipping Algorithm

So (-1, 5) is better than (2, 4)
Find b”&bb”(-1, 5) b (-1, 7)

Mid Point Subdivision Line Clipping Algorithm

So B””to B length of line will be clipped from upper side

Now considered left-hand side portion.

A and B””are now endpoints

Find mid of A and B””

A (-4, 2) B “”(-1, 6)

Mid Point Subdivision Line Clipping Algorithm Mid Point Subdivision Line Clipping Algorithm

Liang-Barsky Line Clipping Algorithm:

Liang and Barsky have established an algorithm that uses floating-point arithmetic but finds the appropriate endpoints with at most four computations. This algorithm uses the parametric equations for a line and solves four inequalities to find the range of the parameter for which the line is in the viewport.

Mid Point Subdivision Line Clipping Algorithm

Let P(x1, y1), Q(x2, y2) is the line which we want to study. The parametric equation of the line segment from gives x-values and y-values for every point in terms of a parameter that ranges from 0 to 1. The equations are

x=x1+(x2-x1 )*t=x1+dx*t and y=y1+(y2-y1 )*t=y1+dy*t

We can see that when t = 0, the point computed is P(x1, y1); and when t = 1, the point computed is Q(x2, y2).


Algorithm of Liang-Barsky Line Clipping:

1. Set tmin=0 and tmax=1

2. Calculate the values tL,tR,tT and tB(tvalues).
If t<tmin or t<tmax? ignore it and go to the next edge
Otherwise classify the tvalue as entering or exiting value (using inner product to classify)
If t is entering value set tmin=t if t is exiting value set tmax=t.</t</t

3. If tmin< tmax? then draw a line from (x1 + dx*tmin, y1 + dy*tmin) to (x1 + dx*tmax?, y1 + dy*tmax? )

4. If the line crosses over the window, you will see (x1 + dx*tmin, y1 + dy*tmin) and (x1 + dx*tmax? , y1 + dy*tmax?) are intersection between line and edge.

Text Clipping:

Several methods are available for clipping of text. Clipping method is dependent on the method of generation used for characters. A simple method is completely considered, or nothing considers method. This method is also called as all or none. If all characters of the string are inside window, then we will keep the string, if a string character is outside then whole string will be discarded in fig (a). Another method is discarded those characters not completely inside the window. If a character overlap boundary of window. Those will be discarded in fig (b).In fig (c) individual character is treated. Character lies on boundary is discarded as which it is outside the window.

Text Clipping

Curve Clipping:

Curve Clipping involves complex procedures as compared to line clipping. Curve clipping requires more processing than for object with linear boundaries. Consider window which is rectangular in shape. The circle is to consider against rectangle window. If circle is completely inside boundary of the window, it is considered visible. So save the circle. If a circle is in outside window, discard it. If circle cut the boundary then consider it to be clipping case.

Exterior Clipping:

It is opposite to previous clipping. Here picture which is outside the window is considered. The picture inside the rectangle window is discarded. So part of the picture outside the window is saved.

Uses of Exterior Clipping:

  1. It is used for displaying properly the pictures which overlap each other.
  2. It is used in the concept of overlapping windows.
  3. It is used for designing various patterns of pictures.
  4. It is used for advertising purposes.
  5. It is suitable for publishing.
  6. For designing and displaying of the number of maps and charts, it is also used.

Polygon Clipping:

Polygon clipping is applied to the polygons. The term polygon is used to define objects having outline of solid. These objects should maintain property and shape of polygon after clipping.

Polygon:

Polygon is a representation of the surface. It is primitive which is closed in nature. It is formed using a collection of lines. It is also called as many-sided figure. The lines combined to form polygon are called sides or edges. The lines are obtained by combining two vertices.

Example of Polygon:

  1. Triangle
  2. Rectangle
  3. Hexagon
  4. Pentagon

Following figures shows some polygons.

PolygonPolygon
Polygon

Types of Polygons

  1. Concave
  2. Convex

A polygon is called convex of line joining any two interior points of the polygon lies inside the polygon. A non-convex polygon is said to be concave. A concave polygon has one interior angle greater than 180°. So that it can be clipped into similar polygons.

PolygonPolygon

A polygon can be positive or negative oriented. If we visit vertices and vertices visit produces counterclockwise circuit, then orientation is said to be positive.

PolygonPolygon

Sutherland-Hodgeman Polygon Clipping:

It is performed by processing the boundary of polygon against each window corner or edge. First of all entire polygon is clipped against one edge, then resulting polygon is considered, then the polygon is considered against the second edge, so on for all four edges.

Four possible situations while processing

  1. If the first vertex is an outside the window, the second vertex is inside the window. Then second vertex is added to the output list. The point of intersection of window boundary and polygon side (edge) is also added to the output line.
  2. If both vertexes are inside window boundary. Then only second vertex is added to the output list.
  3. If the first vertex is inside the window and second is an outside window. The edge which intersects with window is added to output list.
  4. If both vertices are the outside window, then nothing is added to output list.

Following figures shows original polygon and clipping of polygon against four windows.

Sutherland-Hodgeman Polygon Clipping

Disadvantage of Cohen Hodgmen Algorithm:

This method requires a considerable amount of memory. The first of all polygons are stored in original form. Then clipping against left edge done and output is stored. Then clipping against right edge done, then top edge. Finally, the bottom edge is clipped. Results of all these operations are stored in memory. So wastage of memory for storing intermediate polygons.

Sutherland-Hodgeman Polygon Clipping

Weiler-Atherton Polygon Clipping:

Let the clipping window be initially called clip polygon and the polygon to be clipped the subject polygon. We start with an arbitrary vertex of the subject polygon and trace around its border in the clockwise direction until an intersection with the clip polygon is encountered:

1. If the edge enters the clip polygon, record the intersection point and continue to trace the subject polygon.

Weiler-Atherton Polygon Clipping

2. If the edge leaves the clip polygon, record the intersection point and make a right turn to follow the clip polygon in the same manner (i.e., treat the clip polygon as subject polygon and the subject polygon as clip polygon and proceed as before).

Whenever our path of traversal forms a sub-polygon we output the sub-polygon as part of the overall result. We then continue to trace the rest of the original subject polygon from a recorded intersection point that marks the beginning of a not-yet traced edge or portion of an edge. The algorithm terminates when the entire border of the original subject polygon has been traced exactly once.

Weiler-Atherton Polygon Clipping


For example, the number in fig (a) indicates the order in which the edges and portion of edges are traced. We begin at the starting vertex and continue along the same edge (from 1 to 2) of the subject polygon as it enters the clip polygon. As we move along the edge that is leaving the clip polygon, we make a right turn (from 4 to 5) onto the clip polygon, which is now considered the subject polygon. Following the same logic leads to the next right turn (from 5 to 6) onto the current clip polygon, this is the original subject polygon. With the next step done (from 7 to 8) in the same way, we have a sub-polygon for output in fig (b). We then resume our traversal of the original subject polygon from the recorded intersection point where we first changed our course. Going from 9 to 10 to 11 produces no output. After skipping the already traversed 6 and 7, we continue with 12 and 13 and come to an end. The fig (b) is the final result.


Part 12: Hidden Surface Removal and 3D model projection

Part 8: 2D Viewing with types in Computer Graphics

Computer Graphics Window:

The method of selecting and enlarging a portion of a drawing is called windowing. The area chosen for this display is called a window. The window is selected by world-coordinate. Sometimes we are interested in some portion of the object and not in full object. So we will decide on an imaginary box. This box will enclose desired or interested area of the object. Such an imaginary box is called a window.

Viewport: An area on display device to which a window is mapped [where it is to displayed].

Basically, the window is an area in object space. It encloses the object. After the user selects this, space is mapped on the whole area of the viewport. Almost all 2D and 3D graphics packages provide means of defining viewport size on the screen. It is possible to determine many viewports on different areas of display and view the same object in a different angle in each viewport.

The size of the window is (0, 0) coordinate which is a bottom-left corner and toward right side until window encloses the desired area. Once the window is defined data outside the window is clipped before representing to screen coordinates. This process reduces the amount of data displaying signals. The window size of the Tektronix 4.14 tube in Imperial College contains 4.96 points horizontally and 3072 points vertically.

Viewing transformation or window to viewport transformation or windowing transformation: The mapping of a part of a world-coordinate scene to device coordinates is referred to as a viewing transformation etc.

Computer Graphics Window

Viewing transformation in several steps:

  • First, we construct the scene in world coordinate using the output primitives and attributes.
  • To obtain a particular orientation, we can set up a 2-D viewing coordinate system in the window coordinate plane and define a window in viewing coordinates system.
  • Once the viewing frame is established, are then transform description in world coordinates to viewing coordinates.
  • Then, we define viewport in normalized coordinates (range from 0 to 1) and map the viewing coordinates description of the scene to normalized coordinates.
    At the final step, all parts of the picture that (i.e., outside the viewport are dipped, and the contents are transferred to device coordinates).

Computer Graphics Window

By changing the position of the viewport: We can view objects at different locations on the display area of an output device as shown in fig:

Computer Graphics Window

By varying the size of viewports: We can change the size and proportions of displayed objects. We can achieve zooming effects by successively mapping different-sized windows on a fixed-size viewport. As the windows are made smaller, we zoom in on some part of a scene to view details that are not shown with larger windows.

Computer Graphics Window


Computer Graphics Window to Viewport Co-ordinate Transformation

Once object description has been transmitted to the viewing reference frame, we choose the window extends in viewing coordinates and selects the viewport limits in normalized coordinates.

Object descriptions are then transferred to normalized device coordinates:

  • We do this thing using a transformation that maintains the same relative placement of an object in normalized space as they had in viewing coordinates.
  • If a coordinate position is at the center of the viewing window:
    It will display at the center of the viewport.
  • Fig shows the window to viewport mapping. A point at position (xw, yw) in window mapped into position (xv, yv) in the associated viewport.

Computer Graphics Window to Viewport Co-ordinate Transformation

In order to maintain the same relative placement of the point in the viewport as in the window, we require:

Computer Graphics Window to Viewport Co-ordinate Transformation

Solving these impressions for the viewport position (xv, yv), we have

xv=xvmin+(xw-xwmin)sx
yv=yvmin+(yw-ywmin)sy ………..equation 2

Where scaling factors are

Computer Graphics Window to Viewport Co-ordinate Transformation

Equation (1) and Equation (2) can also be derived with a set of transformation that converts the window or world coordinate area into the viewport or screen coordinate area. This conversation is performed with the following sequence of transformations:

  1. Perform a scaling transformation using a fixed point position (xwmin,ywmin) that scales the window area to the size of the viewport.
  2. Translate the scaled window area to the position of the viewport. Relative proportions of objects are maintained if the scaling factors are the same (sx=sy).

From normalized coordinates, object descriptions are mapped to the various display devices.

Any number of output devices can we open in a particular app, and three windows to viewport transformation can be performed for each open output device.

This mapping called workstation transformation (It is accomplished by selecting a window area in normalized space and a viewport area in the coordinates of the display device).

As in fig, workstation transformation to partition a view so that different parts of normalized space can be displayed on various output devices).

Computer Graphics Window to Viewport Co-ordinate Transformation

Matrix Representation of the above three steps of Transformation:

Computer Graphics Window to Viewport Co-ordinate Transformation

Step1:Translate window to origin 1
Tx=-Xwmin Ty=-Ywmin

Step2:Scaling of the window to match its size to the viewport
Sx=(Xymax-Xvmin)/(Xwmax-Xwmin)
Sy=(Yvmax-Yvmin)/(Ywmax-Ywmin)
Step3:Again translate viewport to its correct position on screen.
Tx=Xvmin
Ty=Yvmin

Above three steps can be represented in matrix form:
VT=T * S * T1

T = Translate window to the origin

S=Scaling of the window to viewport size

T1=Translating viewport on screen.

Computer Graphics Window to Viewport Co-ordinate Transformation

Viewing Transformation= T * S * T1

Advantage of Viewing Transformation:

We can display picture at device or display system according to our need and choice.

Note:

  • World coordinate system is selected suits according to the application program.
  • Screen coordinate system is chosen according to the need of design.
  • Viewing transformation is selected as a bridge between the world and screen coordinate.

Computer Graphics Zooming

Zooming is a transformation often provided with an imaginary software. The transformation effectively scales down or blows up a pixel map or a portion of it with the instructions from the user. Such scaling is commonly implemented at the pixel level rather than at the coordinates level. A video display or an image is necessarily a pixel map, i.e., a collection of pixels which are the smallest addressable elements of a picture. The process of zooming replicates pixels along successive scan lines.

Example: for a zoom factor of two

Each pixel value is used four times twice on each of the two successive scan lines.

Figure shows the effect of zooming by a factor of 2.
Computer Graphics Zooming

Such integration of pixels sometimes involves replication using a set of ordered patterns, commonly known as Dithering.

The two most common dither types are:

  • Ordered dither.
  • Random dither.

There are widely used, especially when the grey levels (share of brightness) are synthetically generated.

Computer Graphics Zooming

Computer Graphics Panning

The process of panning acts as a qualifier to the zooming transformation. This step moves the scaled up portion of the image to the center of the screen and depending on the scale factor, fill up the entire screen.

Advantage:

Effective increase in zoom area in all four direction even if the selected image portion (for zooming) is close to the screen boundary.

Inking:

If we sample the position of a graphical input device at regular intervals and display a dot at each sampled position, a trial will be displayed of the movement of the device.This technique which closely simulates the effect of drawing on paper is called Inking.

For many years the primary use of inking has been in conjunction with online character-recognition programs.
Computer Graphics Panning

Scissoring:

In computer graphics, the deleting of any parts of an image which falls outside of a window that has been sized and laid the original vision ever. It is also called the clipping.

Part 12: Hidden Surface Removal and 3D model projection

Part 7: 2D Transformations with types in Computer Graphics

Introduction of Transformations

Computer Graphics provide the facility of viewing object from different angles. The architect can study building from different angles i.e.

  1. Front Evaluation
  2. Side elevation
  3. Top plan

A Cartographer can change the size of charts and topographical maps. So if graphics images are coded as numbers, the numbers can be stored in memory. These numbers are modified by mathematical operations called as Transformation.

The purpose of using computers for drawing is to provide facility to user to view the object from different angles, enlarging or reducing the scale or shape of object called as Transformation.

  1. Each transformation is a single entity. It can be denoted by a unique name or symbol.
  2. It is possible to combine two transformations, after connecting a single transformation is obtained, e.g., A is a transformation for translation. The B transformation performs scaling. The combination of two is C=AB. So C is obtained by concatenation property.

There are two complementary points of view for describing object transformation.

  1. Geometric Transformation: The object itself is transformed relative to the coordinate system or background. The mathematical statement of this viewpoint is defined by geometric transformations applied to each point of the object.
  2. Coordinate Transformation: The object is held stationary while the coordinate system is transformed relative to the object. This effect is attained through the application of coordinate transformations.

An example that helps to distinguish these two viewpoints:

The movement of an automobile against a scenic background we can simulate this by

  • Moving the automobile while keeping the background fixed-(Geometric Transformation)
  • We can keep the car fixed while moving the background scenery- (Coordinate Transformation)

Types of Transformations:

  1. Translation
  2. Scaling
  3. Rotating
  4. Reflection
  5. Shearing

Translation

It is the straight line movement of an object from one position to another is called Translation. Here the object is positioned from one coordinate location to another.

Translation of point:

To translate a point from coordinate position (x, y) to another (x1 y1), we add algebraically the translation distances Tx and Ty to original coordinate.

x1=x+Tx
    y1=y+Ty

The translation pair (Tx,Ty) is called as shift vector.

Translation is a movement of objects without deformation. Every position or point is translated by the same amount. When the straight line is translated, then it will be drawn using endpoints.

For translating polygon, each vertex of the polygon is converted to a new position. Similarly, curved objects are translated. To change the position of the circle or ellipse its center coordinates are transformed, then the object is drawn using new coordinates.

Let P is a point with coordinates (x, y). It will be translated as (x1 y1).

Translation
Translation

Matrix for Translation:

Translation

Scaling:

It is used to alter or change the size of objects. The change is done using scaling factors. There are two scaling factors, i.e. Sx in x direction Sy in y-direction. If the original position is x and y. Scaling factors are Sx and Sy then the value of coordinates after scaling will be x1 and y1.

If the picture to be enlarged to twice its original size then Sx = Sy =2. If Sxand Sy are not equal then scaling will occur but it will elongate or distort the picture.

If scaling factors are less than one, then the size of the object will be reduced. If scaling factors are higher than one, then the size of the object will be enlarged.

If Sxand Syare equal it is also called as Uniform Scaling. If not equal then called as Differential Scaling. If scaling factors with values less than one will move the object closer to coordinate origin, while a value higher than one will move coordinate position farther from origin.

Enlargement: If T1=Scaling,If (x1 y1)is original position and T1is translation vector then (x2 y2) are coordinated after scaling

Scaling

The image will be enlarged two times

Scaling

Reduction: If T1=Scaling. If (x1 y1) is original position and T1 is translation vector, then (x2 y2) are coordinates after scaling

Scaling
Scaling
Scaling
Scaling

Matrix for Scaling:

Scaling

Example: Prove that 2D Scaling transformations are commutative i.e, S1 S2=S2 S1.

Solution: S1 and S2 are scaling matrices

Scaling

Rotation:

It is a process of changing the angle of the object. Rotation can be clockwise or anticlockwise. For rotation, we have to specify the angle of rotation and rotation point. Rotation point is also called a pivot point. It is print about which object is rotated.

Types of Rotation:

  1. Anticlockwise
  2. Counterclockwise

The positive value of the pivot point (rotation angle) rotates an object in a counter-clockwise (anti-clockwise) direction. The negative value of the pivot point (rotation angle) rotates an object in a clockwise direction. When the object is rotated, then every point of the object is rotated by the same angle.

Straight Line: Straight Line is rotated by the endpoints with the same angle and redrawing the line between new endpoints.

Polygon: Polygon is rotated by shifting every vertex using the same rotational angle.

Curved Lines: Curved Lines are rotated by repositioning of all points and drawing of the curve at new positions.

Circle: It can be obtained by center position by the specified angle.

Ellipse: Its rotation can be obtained by rotating major and minor axis of an ellipse by the desired angle.

Rotation
Rotation

Matrix for rotation is a clockwise direction.

Rotation

Matrix for rotation is an anticlockwise direction.

Rotation

Matrix for homogeneous co-ordinate rotation (clockwise)

Rotation

Matrix for homogeneous co-ordinate rotation (anticlockwise)

Rotation


Rotation about an arbitrary point:

If we want to rotate an object or point about an arbitrary point, first of all, we translate the point about which we want to rotate to the origin. Then rotate point or object about the origin, and at the end, we again translate it to the original place. We get rotation about an arbitrary point.

Example: The point (x, y) is to be rotated

The (xc yc) is a point about which counterclockwise rotation is done

Step1: Translate point (xc yc) to origin

Rotation

Step2: Rotation of (x, y) about the origin

Rotation

Step3: Translation of center of rotation back to its original position

Rotation
Rotation

Example1: Prove that 2D rotations about the origin are commutative i.e. R1 R2=R2 R1.

Solution: R1 and R2are rotation matrices

Rotation

Reflection:

It is a transformation which produces a mirror image of an object. The mirror image can be either about x-axis or y-axis. The object is rotated by180°.

Types of Reflection:

  1. Reflection about the x-axis
  2. Reflection about the y-axis
  3. Reflection about an axis perpendicular to xy plane and passing through the origin
  4. Reflection about line y=x

1. Reflection about x-axis: The object can be reflected about x-axis with the help of the following matrix

Reflection

In this transformation value of x will remain same whereas the value of y will become negative. Following figures shows the reflection of the object axis. The object will lie another side of the x-axis.

Reflection

2. Reflection about y-axis: The object can be reflected about y-axis with the help of following transformation matrix

Reflection

Here the values of x will be reversed, whereas the value of y will remain the same. The object will lie another side of the y-axis.

The following figure shows the reflection about the y-axis

Reflection

3. Reflection about an axis perpendicular to xy plane and passing through origin:
In the matrix of this transformation is given below

Reflection
Reflection

In this value of x and y both will be reversed. This is also called as half revolution about the origin.


4. Reflection about line y=x: The object may be reflected about line y = x with the help of following transformation matrix

Reflection
Reflection

First of all, the object is rotated at 45°. The direction of rotation is clockwise. After it reflection is done concerning x-axis. The last step is the rotation of y=x back to its original position that is counterclockwise at 45°.

Example: Find reflected position of triangle i.e., to the x-axis.

Solution:

Reflection
Reflection

The a point coordinates after reflection

Reflection

The b point coordinates after reflection

Reflection

The coordinate of point c after reflection

Reflection

a (3, 4) becomes a1 (3, -4)
b (6, 4) becomes b1 (6, -4)
c (4, 8) becomes c1 (4, -8)

Shearing:

It is transformation which changes the shape of object. The sliding of layers of object occur. The shear can be in one direction or in two directions.

Shearing in the X-direction:

In this horizontal shearing sliding of layers occur. The homogeneous matrix for shearing in the x-direction is shown below:

Shearing
Shearing

Shearing in the Y-direction: Here shearing is done by sliding along vertical or y-axis.

Shearing

Shearing in X-Y directions:

Here layers will be sided in both x as well as y direction. The sliding will be in horizontal as well as vertical direction. The shape of the object will be distorted. The matrix of shear in both directions is given by:

Shearing

Composite Transformation:

A number of transformations or sequence of transformations can be combined into single one called as composition. The resulting matrix is called as composite matrix. The process of combining is called as concatenation. Suppose we want to perform rotation about an arbitrary point, then we can perform it by the sequence of three transformations

  1. Translation
  2. Rotation
  3. Reverse Translation

The ordering sequence of these numbers of transformations must not be changed. If a matrix is represented in column form, then the composite transformation is performed by multiplying matrix in order from right to left side. The output obtained from the previous matrix is multiplied with the new coming matrix.

Example showing composite transformations:

The enlargement is with respect to center. For this following sequence of transformations will be performed and all will be combined to a single one. Composition of two Scaling: The composition of two scaling is multiplicative. Let S11 and S12are matrix to be multiplied.

Composite Transformation

Step1: The object is kept at its position as in fig (a)

Step2: The object is translated so that its center coincides with the origin as in fig (b)

Step3: Scaling of an object by keeping the object at origin is done in fig (c)

Step4: Again translation is done. This second translation is called a reverse translation. It will position the object at the origin location.

Above transformation can be represented as TV.STV-1

Composite Transformation

Note: Two types of rotations are used for representing matrices one is column method. Another is the row method.

Composite Transformation

Advantage of composition or concatenation of matrix:

  1. It transformations become compact.
  2. The number of operations will be reduced.
  3. Rules used for defining transformation in form of equations are complex as compared to matrix.

Composition of two translations:

Let t1 t2 t3 t4are translation vectors. They are two translations P1 and P2. The matrix of P1 and P2 given below. The P1 and P2are represented using Homogeneous matrices and P will be the final transformation matrix obtained after multiplication.

Composite Transformation

Above resultant matrix show that two successive translations are additive.

Composition of two Rotations: Two Rotations are also additive

Composition of two Scaling: The composition of two scaling is multiplicative. Let S11 and S12are matrix to be multiplied.

Composite Transformation

Part 12: Hidden Surface Removal and 3D model projection

Part 6: Filled Area Primitives different algorithm on Computer Graphics.

Filled Area Primitives:

Region filling is the process of filling image or region. Filling can be of boundary or interior region as shown in fig. Boundary Fill algorithms are used to fill the boundary and flood-fill algorithm are used to fill the interior.

Filled Area Primitives

Boundary Filled Algorithm:
This algorithm uses the recursive method. First of all, a starting pixel called as the seed is considered. The algorithm checks boundary pixel or adjacent pixels are colored or not. If the adjacent pixel is already filled or colored then leave it, otherwise fill it.

Boundary Filled Algorithm

The filling is done using four connected or eight connected approaches.

Boundary Filled Algorithm

Four connected approaches is more suitable than the eight connected approaches.

1. Four connected approaches: In this approach, left, right, above, below pixels are tested.

2. Eight connected approaches: In this approach, left, right, above, below and four diagonals are selected.

Boundary can be checked by seeing pixels from left and right first. Then pixels are checked by seeing pixels from top to bottom. The algorithm takes time and memory because some recursive calls are needed.

Problem with recursive boundary fill algorithm:
It may not fill regions sometimes correctly when some interior pixel is already filled with color. The algorithm will check this boundary pixel for filling and will found already filled so recursive process will terminate. This may vary because of another interior pixel unfilled.

So check all pixels color before applying the algorithm.

Algorithm:

Procedure fill (x, y, color, color1: integer)
int c;
c=getpixel (x, y);
if (c!=color) (c!=color1)
{
setpixel (x, y, color)
fill (x+1, y, color, color 1);
fill (x-1, y, color, color 1);
fill (x, y+1, color, color 1);
fill (x, y-1, color, color 1);
}

Flood Fill Algorithm:

In this method, a point or seed which is inside region is selected. This point is called a seed point. Then four connected approaches or eight connected approaches is used to fill with specified color.

The flood fill algorithm has many characters similar to boundary fill. But this method is more suitable for filling multiple colors boundary. When boundary is of many colors and interior is to be filled with one color we use this algorithm.


In fill algorithm, we start from a specified interior point (x, y) and reassign all pixel values are currently set to a given interior color with the desired color. Using either a 4-connected or 8-connected approaches, we then step through pixel positions until all interior points have been repainted.

Disadvantage:

  1. Very slow algorithm
  2. May be fail for large polygons
  3. Initial pixel required more knowledge about surrounding pixels.

Algorithm:

  1. Procedure floodfill (x, y,fill_ color, old_color: integer)  
        If (getpixel (x, y)=old_color)  
       {  
        setpixel (x, y, fill_color);  
        fill (x+1, y, fill_color, old_color);  
         fill (x-1, y, fill_color, old_color);  
        fill (x, y+1, fill_color, old_color);  
        fill (x, y-1, fill_color, old_color);  
         }  
    }


Program1: To implement 4-connected flood fill algorithm:

  1. #include<stdio.h>  
    #include<conio.h>  
    #include<graphics.h>  
    #include<dos.h>  
    void flood(int,int,int,int);  
    void main()  
    {  
        intgd=DETECT,gm;  
        initgraph(&gd,&gm,"C:/TURBOC3/bgi");  
        rectangle(50,50,250,250);  
        flood(55,55,10,0);  
        getch();  
    }  
    void flood(intx,inty,intfillColor, intdefaultColor)  
    {  
        if(getpixel(x,y)==defaultColor)  
        {  
            delay(1);  
            putpixel(x,y,fillColor);  
            flood(x+1,y,fillColor,defaultColor);  
            flood(x-1,y,fillColor,defaultColor);  
            flood(x,y+1,fillColor,defaultColor);  
            flood(x,y-1,fillColor,defaultColor);  
        }  
    }

    Output:

Flood Fill Algorithm

Program2: To implement 8-connected flood fill algorithm:

  1. #include<stdio.h>  
    #include<graphics.h>  
    #include<dos.h>  
    #include<conio.h>  
    void floodfill(intx,inty,intold,intnewcol)  
    {  
                    int current;  
                    current=getpixel(x,y);  
                    if(current==old)  
                    {  
                                    delay(5);  
                                    putpixel(x,y,newcol);  
                                    floodfill(x+1,y,old,newcol);  
                                    floodfill(x-1,y,old,newcol);  
                                    floodfill(x,y+1,old,newcol);  
                                    floodfill(x,y-1,old,newcol);  
                                    floodfill(x+1,y+1,old,newcol);  
                                    floodfill(x-1,y+1,old,newcol);  
                                    floodfill(x+1,y-1,old,newcol);  
                                    floodfill(x-1,y-1,old,newcol);  
                    }  
    }  
    void main()  
    {  
                    intgd=DETECT,gm;  
                    initgraph(&gd,&gm,"C:\\TURBOC3\\BGI");  
                    rectangle(50,50,150,150);  
                    floodfill(70,70,0,15);  
                    getch();  
                    closegraph();  
    }

Output:

Flood Fill Algorithm

Scan Line Polygon Fill Algorithm:

This algorithm lines interior points of a polygon on the scan line and these points are done on or off according to requirement. The polygon is filled with various colors by coloring various pixels.

In above figure polygon and a line cutting polygon in shown. First of all, scanning is done. Scanning is done using raster scanning concept on display device. The beam starts scanning from the top left corner of the screen and goes toward the bottom right corner as the endpoint. The algorithms find points of intersection of the line with polygon while moving from left to right and top to bottom. The various points of intersection are stored in the frame buffer. The intensities of such points is keep high. Concept of coherence property is used. According to this property if a pixel is inside the polygon, then its next pixel will be inside the polygon.

Scan Line Polygon Fill Algorithm

Side effects of Scan Conversion:

1. Staircase or Jagged: Staircase like appearance is seen while the scan was converting line or circle.

2. Unequal Intensity: It deals with unequal appearance of the brightness of different lines. An inclined line appears less bright as compared to the horizontal and vertical line.

Scan Line Polygon Fill Algorithm
Part 12: Hidden Surface Removal and 3D model projection

Part 5: Scan conversion an Ellipse using different Methods and Algorithm

Scan Converting a Ellipse:

The ellipse is also a symmetric figure like a circle but is four-way symmetry rather than eight-way.

Scan Converting a Ellipse

Program to Implement Ellipse Drawing Algorithm:

  1. #include<stdio.h>
    #include<conio.h>
    #include<graphics.h>
    #include<math.h>
    void display();
    float x,y;
    int xc,yc;
    int main()
    {
    int gd=DETECT,gm,a,b;
    float p1,p2;
    //clrscr();
    initgraph(&gd,&gm,"c:\\turboc3\\bgi");
    printf(" Ellipse Generating Algorithm \n\n");
    printf("Enter the value of Xc\t");
    scanf("%d",&xc);
    printf("Enter the value of Yc\t");
    scanf("%d",&yc);
    printf("Enter X axis length\t");
    scanf("%d",&a);
    printf("Enter Y axis length\t");
    scanf("%d",&b);
    x=0;y=b;
    display();
    p1=(b*b)-(a*a*b)+(a*a)/4;
    while((2.0*b*b*x)<=(2.0*a*a*y))
    {
    x++;
    if(p1<=0)
    p1=p1+(2.0*b*b*x)+(b*b);
    else
    {
    y--;
    p1=p1+(2.0*b*b*x)+(b*b)-(2.0*a*a*y);
    }
    display();
    x=-x;
    display();
    x=-x;
    delay(50);
    }
    x=a;
    y=0;
    display();
    p2=(a*a)+2.0*(b*b*a)+(b*b)/4;
    while((2.0*b*b*x)>(2.0*a*a*y))
    {
    y++;
    if(p2>0)
    p2=p2+(a*a)-(2.0*a*a*y);
    else
    {
    x--;
    p2=p2+(2.0*b*b*x)-(2.0*a*a*y)+(a*a);
    }
    display();
    y=-y;
    display();
    y=-y;
    delay(50);
    }
    getch();
    closegraph();
    }
    void display()
    {
    putpixel(xc+x,yc+y,7);
    putpixel(xc-x,yc+y,7);
    putpixel(xc+x,yc-y,7);
    putpixel(xc+x,yc-y,7);
    }

    Output:

Ellipse Drawing Algorithm

There two methods of defining an Ellipse:

  1. Polynomial Method of defining an Ellipse
  2. Trigonometric method of defining an Ellipse

Polynomial Method:

The ellipse has a major and minor axis. If a1 and b1are major and minor axis respectively. The centre of ellipse is (i, j). The value of x will be incremented from i to a1and value of y will be calculated using the following formula

Polynomial Method

Drawback of Polynomial Method:

  1. It requires squaring of values. So floating point calculation is required.
  2. Routines developed for such calculations are very complex and slow.

Polynomial Method

Algorithm:

1. Set the initial variables: a = length of major axis; b = length of minor axis; (h, k) = coordinates of ellipse center; x = 0; i = step; xend = a.

2. Test to determine whether the entire ellipse has been scan-converted. If x>xend, stop.

3. Compute the value of the y coordinate:

Polynomial Method

4. Plot the four points, found by symmetry, at the current (x, y) coordinates:

Plot (x + h, y + k)           Plot (-x + h, -y + k)           Plot (-y – h, x + k)           Plot (y + h, -x + k)

5. Increment x; x = x + i.

6. Go to step 2.

Program to draw an Ellipse using Polynomial Method:

#include <graphics.h>
#include <stdlib.h>
#include <math.h>
#include <stdio.h>
#include <conio.h>
#include <iostream>
using namespace std;
class bresen
{
    float x, y, a, b, r, t, te, xend, h, k, step;
    public:
    void get ();
    void cal ();
};
    int main ()
    {
    bresen b;
    b.get ();
    b.cal ();
    getch ();
   }
    void bresen :: get ()
   {
    cout<<"\n ENTER CENTER OF ELLIPSE";
    cout<<"\n enter (h, k) ";
    cin>>h>>k;
    cout<<"\n ENTER LENGTH OF MAJOR AND MINOR AXIS";
    cin>>a>>b;
    cout<<"\n ENTER Step Size";
    cin>> step;
   }
void bresen ::cal ()
{
    /* request auto detection */
    int gdriver = DETECT,gmode, errorcode;
    int midx, midy, i;
    /* initialize graphics and local variables */
    initgraph (&gdriver, &gmode, " ");
    /* read result of initialization */
    errorcode = graphresult ();
    if (errorcode != grOk) /* an error occurred */
{
printf("Graphics error: %s\n", grapherrormsg(errorcode));
printf("Press any key to halt:");
getch();
exit(1); /* terminate with an error code */
}
    x = 0;
    xend=a;
    while (x<xend)
    {
        t= (1-((x * x)/ (a * a)));
        if (t<0)
            te=-t;
        else
            te=t;
        y=b * sqrt (te);
        putpixel (h+x, k+y, RED);
        putpixel (h-x, k+y, RED);
        putpixel (h+x, y-y, RED);
        putpixel (h-x, k-y, RED);
        x+=step;
    }
    getch();
}

Output:

Polynomial Method

Trignometric Method:

The following equation defines an ellipse trigonometrically as shown in fig:

x = a * cos (θ) +h and
y = b * sin (θ)+k
where (x, y) = the current coordinates
a = length of major axis
b = length of minor axis
θ= current angle
(h, k) = ellipse center

In this method, the value of θ is varied from 0 to Trignometric Method radians. The remaining points are found by symmetry.

Trignometric Method

Drawback:

  1. This is an inefficient method.
  2. It is not an interactive method for generating ellipse.
  3. The table is required to see the trigonometric value.
  4. Memory is required to store the value of θ.

Algorithm:

Step1: Start Algorithm

Step2: Declare variable x1,y1,aa1,bb1,aa2,bb2,fx,fy,p1,a1,b1

Step3: Initialize x1=0 and y1=b/* values of starting point of circle */

Step4: Calculate aa1=a1*a1
Calculate bb1=b1* b1
Calculate aa2=aa1*2
Calculate bb2=bb1*2

Step5: Initialize fx = 0

Step6: Initialize fy = aa_2* b1

Step7: Calculate the value of p1and round if it is integer
p1=bb1-aa1* b1+0.25* aa1/

Step8:

While (fx < fy)
  {
    Set pixel (x1,y1)
                      Increment x i.e., x = x + 1
                      Calculate fx = fx + bb2
                       If (p1 < 0)
                                 Calculate p1 = p1 + fx + bb1/
                       else
    {
      Decrement y i.e., y = y-1
                        Calculate fy = fy - 992;
        p1=p1 + fx + bb1-fy
                        }
                }


Step9: Setpixel (x1,y1)

Step10: Calculate p1=bb1 (x+.5)(x+.5)+aa(y-1)(y-1)-aa1*bb1

Step 11:

While (y1>0)
                {
                          Decrement y i.e., y = y-1
                           fy=fx-aa2/
                         if (p1>=0)
       p1=p1 - fx +  aa1/
                        else
                 {
                        Increment x i.e., x = x + 1
                        fx= fx+bb_2
                        p1=p1+fx-fy-aa1
                  }
        }
       Set pixel (x1,y1)

Step12: Stop Algorithm

Program to draw a circle using Trigonometric method:

#include <graphics.h>
#include <stdlib.h>
#include <math.h>
#include <stdio.h>
#include <conio.h>
#include <iostream>
# define pi 3.14
using namespace std;
class bresen
{
    float a, b, h, k, thetaend,step,x,y;
    int i;
    public:
    void get ();
    void cal ();
};
    int main ()
    {
    bresen b;
    b.get ();
    b.cal ();
    getch ();
   }
    void bresen :: get ()
   {
    cout<<"\n ENTER CENTER OF ELLIPSE";
    cin>>h>>k;
    cout<<"\n ENTER LENGTH OF MAJOR AND MINOR AXIS";
    cin>>a>>b;
    cout<<"\n ENTER STEP SIZE";
    cin>> step;
   }
void bresen ::cal ()
{
    /* request auto detection */
    int gdriver = DETECT,gmode, errorcode;
    int midx, midy, i;
    /* initialize graphics and local variables */
    initgraph (&gdriver, &gmode, " ");
    /* read result of initialization */
    errorcode = graphresult ();
    if (errorcode != grOk) /* an error occurred */
{
printf("Graphics error: %s\n", grapherrormsg(errorcode));
printf("Press any key to halt:");
getch();
exit(1); /* terminate with an error code */
}
    int theta = 0;
    thetaend=(pi*90)/180;
    while (theta<thetaend)
    {
        x = a * cos (theta);
        y = b * sin (theta);
        putpixel (x+h, y+k, RED);
        putpixel (-x+h, y+k, RED);
        putpixel (-x+h, -y+k, RED);
        putpixel (x+h, -y+k, RED);
        theta+=step;
    }
        getch();
}

Output:

Trignometric Method

Ellipse Axis Rotation:

Since the ellipse shows four-way symmetry, it can easily be rotated. The new equation is found by trading a and b, the values which describe the major and minor axes. When the polynomial method is used, the equations used to describe the ellipse become

Trignometric Method

where (h, k) = ellipse center
a = length of the major axis
b = length of the minor axis
In the trigonometric method, the equations are
x = b cos (θ)+h       and       y=a sin(θ)+k

Where (x, y) = current coordinates
a = length of the major axis
b = length of the minor axis
θ = current angle
(h, k) = ellipse center

Assume that you would like to rotate the ellipse through an angle other than 90 degrees. The rotation of the ellipse may be accomplished by rotating the x &y axis α degrees.

x = a cos (0) – b sin (0+ ∞) + h y= b (sin 0) + a cos (0+∞) + k

Trignometric Method

Midpoint Ellipse Algorithm:

This is an incremental method for scan converting an ellipse that is centered at the origin in standard position i.e., with the major and minor axis parallel to coordinate system axis. It is very similar to the midpoint circle algorithm. Because of the four-way symmetry property we need to consider the entire elliptical curve in the first quadrant.

Let’s first rewrite the ellipse equation and define the function f that can be used to decide if the midpoint between two candidate pixels is inside or outside the ellipse:

Midpoint Ellipse Algorithm

Now divide the elliptical curve from (0, b) to (a, 0) into two parts at point Q where the slope of the curve is -1.

Slope of the curve is defined by the f(x, y) = 0 isMidpoint Ellipse Algorithmwhere fx & fy are partial derivatives of f(x, y) with respect to x & y.

We have fx = 2b2 x, fy=2a2 y & Midpoint Ellipse Algorithm Hence we can monitor the slope value during the scan conversion process to detect Q. Our starting point is (0, b)

Suppose that the coordinates of the last scan converted pixel upon entering step i are (xi,yi). We are to select either T (xi+1),yi) or S (xi+1,yi-1) to be the next pixel. The midpoint of T & S is used to define the following decision parameter.

pi = f(xi+1),yiMidpoint Ellipse Algorithm)
pi=b2 (xi+1)2+a2 (yiMidpoint Ellipse Algorithm)2-a2 b2

If pi<0, the midpoint is inside the curve and we choose pixel T.

If pi>0, the midpoint is outside or on the curve and we choose pixel S.

Decision parameter for the next step is:

pi+1=f(xi+1+1,yi+1Midpoint Ellipse Algorithm)
= b2 (xi+1+1)2+a2 (yi+1Midpoint Ellipse Algorithm)2-a2 b2

Since xi+1=xi+1,we have
pi+1-pi=b2[((xi+1+1)2+a2 (yi+1Midpoint Ellipse Algorithm)2-(yi –Midpoint Ellipse Algorithm)2]
pi+1= pi+2b2 xi+1+b2+a2 [(yi+1Midpoint Ellipse Algorithm)2-(yi –Midpoint Ellipse Algorithm)2]

If T is chosen pixel (pi<0), we have yi+1=yi.

If S is chosen pixel (pi>0) we have yi+1=yi-1. Thus we can express

pi+1in terms of pi and (xi+1,yi+1):           pi+1= pi+2b2 xi+1+b2          if pi<0           = pi+2b2 xi+1+b2-2a2 yi+1 if pi>0

The initial value for the recursive expression can be obtained by the evaluating the original definition of pi with (0, b):

p1 = (b2+a2 (b-Midpoint Ellipse Algorithm)2-a2 b2
= b2-a2 b+a2/4

Suppose the pixel (xj yj) has just been scan converted upon entering step j. The next pixel is either U (xj ,yj-1) or V (xj+1,yj-1). The midpoint of the horizontal line connecting U & V is used to define the decision parameter:

qj=f(xj+Midpoint Ellipse Algorithm,yj-1)
qj=b2 (xj+Midpoint Ellipse Algorithm)2+a2 (yj -1)2-a2 b2

If qj<0, the midpoint is inside the curve and we choose pixel V.

If qj≥0, the midpoint is outside the curve and we choose pixel U.Decision parameter for the next step is:

qj+1=f(xj+1+Midpoint Ellipse Algorithm,yj+1-1)
= b2 (xj+1+Midpoint Ellipse Algorithm)2+ a2 (yj+1-1)2– a2 b2

Since yj+1=yj-1,we have
qj+1-qj=b2 [(xj+1+Midpoint Ellipse Algorithm)2-(xj +Midpoint Ellipse Algorithm)2 ]+a2 (yj+1-1)2-( yj+1)2 ]
qj+1=qj+b2 [(xj+1+Midpoint Ellipse Algorithm)2-(xj +Midpoint Ellipse Algorithm)2]-2a2 yj+1+a2

If V is chosen pixel (qj<0), we have xj+1=xj.

If U is chosen pixel (pi>0) we have xj+1=xj. Thus we can express

qj+1in terms of qj and (xj+1,yj+1 ):
qj+1=qj+2b2 xj+1-2a2 yj+1+a2          if qj < 0
=qj-2a2 yj+1+a2          if qj>0

The initial value for the recursive expression is computed using the original definition of qj. And the coordinates of (xk yk) of the last pixel choosen for the part 1 of the curve:

q1 = f(xk+Midpoint Ellipse Algorithm,yk-1)=b2 (xk+Midpoint Ellipse Algorithm)2-a2 (yk-1)2– a2 b2

Algorithm:

int x=0, y=b; [starting point]
int fx=0, fy=2a2 b [initial partial derivatives]
int p = b2-a2 b+a2/4
while (fx2;
  if (p<0)
  p = p + fx +b2;
  else
  {
    y--;
    fy=fy-2a2
    p = p + fx +b2-fy;
  }
}
Setpixel (x, y);
p=b2(x+0.5)2+ a2 (y-1)2- a2 b2
while (y>0)
{
  y--;
  fy=fy-2a2;
  if (p>=0)
  p=p-fy+a2
           else
  {
    x++;
    fx=fx+2b2
    p=p+fx-fy+a2;
  }
  Setpixel (x,y);
}

Program to draw an ellipse using Midpoint Ellipse Algorithm:

#include <graphics.h>  
#include <stdlib.h>  
#include <math.h>  
#include <stdio.h>  
#include <conio.h>  
#include <iostream.h>  
  
class bresen  
{  
    float x,y,a, b,r,p,h,k,p1,p2;  
    public:  
    void get ();  
    void cal ();  
};  
    void main ()  
    {  
    bresen b;  
    b.get ();  
    b.cal ();  
    getch ();  
   }  
    void bresen :: get ()  
   {  
    cout<<"\n ENTER CENTER OF ELLIPSE";  
    cout<<"\n ENTER (h, k) ";   
           cin>>h>>k;  
    cout<<"\n ENTER LENGTH OF MAJOR AND MINOR AXIS";  
    cin>>a>>b;  
  }  
void bresen ::cal ()  
{  
    /* request auto detection */  
    int gdriver = DETECT,gmode, errorcode;  
    int midx, midy, i;  
    /* initialize graphics and local variables */  
    initgraph (&gdriver, &gmode, " ");  
    /* read result of initialization */  
    errorcode = graphresult ();  
    if (errorcode ! = grOK)    /*an error occurred */  
    {  
        printf("Graphics error: %s \n", grapherrormsg (errorcode);  
        printf ("Press any key to halt:");  
        getch ();  
        exit (1); /* terminate with an error code */  
    }  
    x=0;  
    y=b;  
    // REGION 1  
    p1 =(b * b)-(a * a * b) + (a * a)/4);  
    {  
        putpixel (x+h, y+k, RED);  
        putpixel (-x+h, -y+k, RED);  
        putpixel (x+h, -y+k, RED);  
        putpixel (-x+h, y+k, RED);  
        if (p1 < 0)  
            p1 += ((2 *b * b) *(x+1))-((2 * a * a)*(y-1)) + (b * b);  
        else  
        {  
            p1+= ((2 *b * b) *(x+1))-((2 * a * a)*(y-1))-(b * b);  
            y--;          
        }  
        x++;  
    }  
    //REGION 2  
    p2 =((b * b)* (x + 0.5))+((a * a)*(y-1) * (y-1))-(a * a *b * b);  
    while (y>=0)  
    {  
        If (p2>0)  
        p2=p2-((2 * a * a)* (y-1))+(a *a);  
        else  
        {  
        p2=p2-((2 * a * a)* (y-1))+((2 * b * b)*(x+1))+(a * a);  
        x++;  
        }  
        y--;  
        putpixel (x+h, y+k, RED);  
        putpixel (-x+h, -y+k, RED);  
        putpixel (x+h, -y+k, RED);  
        putpixel (-x+h, y+k, RED);  
    }  
    getch();  
}

Output:

Midpoint Ellipse Algorithm

Part 12: Hidden Surface Removal and 3D model projection

How to include graphics.h in CodeBlocks?

How to include graphics.h in CodeBlocks?

Compiling graphics codes on CodeBlocks IDE shows an error: “Cannot find graphics.h”. This is because graphics.h runs is not available in the library folder of CodeBlocks. To successfully compile graphics code on CodeBlocks, setup winBGIm library.

How to include graphics.h in CodeBlocks ?

Please follow below steps in sequence to include “graphics.h” in CodeBlocks to successfully compile graphics code on Codeblocks.
Step 1 : To setup “graphics.h” in CodeBlocks, first set up winBGIm graphics library. Download WinBGIm from http://winbgim.codecutter.org/ or use this link.

Step 2 : Extract the downloaded file. There will be three files:

  • graphics.h
  • winbgim.h
  • libbgi.a

    Step 3 : Copy and paste graphics.h and winbgim.h files into the include folder of compiler directory. (If you have Code::Blocks installed in C drive of your computer, go through: Disk C >> Program Files >> CodeBlocks >> MinGW >> include. Paste these two files there.) If any pop up window shows click continue.


  • Step 4 : Copy and paste libbgi.a to the lib folder of compiler directory. If any pop up window shows click continue.


  • Step 5 : Open Code::Blocks. Go to Settings >> Compiler >> Linker settings.

    Step 6 : In that window, click the Add button under the “Link libraries” part, and browse.

    Select the libbgi.a file copied to the lib folder in step 4.

    Step 7 : In right part (ie. other linker options) paste commands

    -lbgi -lgdi32 -lcomdlg32 -luuid -loleaut32 -lole32

    Step 8 : Click Ok

    Step 9 : Try compiling a graphics.h program in C or C++, still there will be an error. To solve it, open graphics.h file (pasted in include folder in step 3) with Codeblocks or Notepad++. Go to line number 302, and replace that line with this line : int left=0, int top=0, int right=INT_MAX, int bottom=INT_MAX,

    Step 10 : Save the file. Done !

    Note : Now, you can compile any C or C++ program containing graphics.h header file. If you compile C codes, you’ll still get an error saying: “fatal error: sstream : no such file directory”.

    For this issue, change your file extension to .cpp if it is .c

Part 12: Hidden Surface Removal and 3D model projection

Part 4: Bresenham’s and Midpoint Circle Algorithm

Bresenham’s Circle Algorithm:

Scan-Converting a circle using Bresenham’s algorithm works as follows: Points are generated from 90° to 45°, moves will be made only in the +x & -y directions as shown in fig:

Bresenham's Circle Algorithm
The best approximation of the true circle will be described by those pixels in the raster that falls the least distance from the true circle. We want to generate the points from

Bresenham's Circle Algorithm
90° to 45°. Assume that the last scan-converted pixel is P1 as shown in fig. Each new point closest to the true circle can be found by taking either of two actions.

Move in the x-direction one unit or
Move in the x- direction one unit & move in the negative y-direction one unit.
Let D (Si) is the distance from the origin to the true circle squared minus the distance to point P3 squared. D (Ti) is the distance from the origin to the true circle squared minus the distance to point P2 squared. Therefore, the following expressions arise.


D (Si)=(xi-1+1)2+ yi-12 -r2
D (Ti)=(xi-1+1)2+(yi-1 -1)2-r2

Since D (Si) will always be +ve & D (Ti) will always be -ve, a decision variable d may be defined as follows:

Bresenham's Circle Algorithm

Bresenham’s Circle Algorithm
di=D (Si )+ D (Ti)

Therefore,
di=(xi-1+1)2+ yi-12 -r2+(xi-1+1)2+(yi-1 -1)2-r2

From this equation, we can drive initial values of di as

If it is assumed that the circle is centered at the origin, then at the first step x = 0 & y = r.

Therefore,
di=(0+1)2+r2 -r2+(0+1)2+(r-1)2-r2
=1+1+r2-2r+1-r2
= 3 – 2r

Thereafter, if d_i<0,then only x is incremented.

xi+1=xi+1 di+1=di+ 4xi+6

& if di≥0,then x & y are incremented
xi+1=xi+1 yi+1 =yi+ 1
di+1=di+ 4 (xi-yi)+10

Bresenham’s Circle Algorithm:
Step1: Start Algorithm

Step2: Declare p, q, x, y, r, d variables
p, q are coordinates of the center of the circle
r is the radius of the circle

Step3: Enter the value of r

Step4: Calculate d = 3 – 2r

Step5: Initialize x=0
&nbsy= r

Step6: Check if the whole circle is scan converted
If x > = y
Stop

Step7: Plot eight points by using concepts of eight-way symmetry. The center is at (p, q). Current active pixel is (x, y).
putpixel (x+p, y+q)
putpixel (y+p, x+q)
putpixel (-y+p, x+q)
putpixel (-x+p, y+q)
putpixel (-x+p, -y+q)
putpixel (-y+p, -x+q)
putpixel (y+p, -x+q)
putpixel (x+p, -y-q)

Step8: Find location of next pixels to be scanned
If d < 0
then d = d + 4x + 6
increment x = x + 1
If d ≥ 0
then d = d + 4 (x – y) + 10
increment x = x + 1
decrement y = y – 1

Step9: Go to step 6

Step10: Stop Algorithm

Example: Plot 6 points of circle using Bresenham Algorithm. When radius of circle is 10 units. The circle has centre (50, 50).

Solution: Let r = 10 (Given)

Step1: Take initial point (0, 10)
d = 3 – 2r
d = 3 – 2 * 10 = -17
d < 0 ∴ d = d + 4x + 6
= -17 + 4 (0) + 6
= -11

Step2: Plot (1, 10)
d = d + 4x + 6 (∵ d < 0)
= -11 + 4 (1) + 6
= -1

Step3: Plot (2, 10)
d = d + 4x + 6 (∵ d < 0)
= -1 + 4 x 2 + 6
= 13

Step4: Plot (3, 9) d is > 0 so x = x + 1, y = y – 1
d = d + 4 (x-y) + 10 (∵ d > 0)
= 13 + 4 (3-9) + 10
= 13 + 4 (-6) + 10
= 23-24=-1

Step5: Plot (4, 9)
d = -1 + 4x + 6
= -1 + 4 (4) + 6
= 21

Step6: Plot (5, 8)
d = d + 4 (x-y) + 10 (∵ d > 0)
= 21 + 4 (5-8) + 10
= 21-12 + 10 = 19

So P1 (0,0)⟹(50,50)
P2 (1,10)⟹(51,60)
P3 (2,10)⟹(52,60)
P4 (3,9)⟹(53,59)
P5 (4,9)⟹(54,59)
P6 (5,8)⟹(55,58)

Program to draw a circle using Bresenham’s circle drawing algorithm:

#include <graphics.h>
#include <stdlib.h>
#include <stdio.h>
#include <conio.h>
#include <math.h>

void EightWaySymmetricPlot(int xc,int yc,int x,int y)
{
putpixel(x+xc,y+yc,RED);
putpixel(x+xc,-y+yc,YELLOW);
putpixel(-x+xc,-y+yc,GREEN);
putpixel(-x+xc,y+yc,YELLOW);
putpixel(y+xc,x+yc,12);
putpixel(y+xc,-x+yc,14);
putpixel(-y+xc,-x+yc,15);
putpixel(-y+xc,x+yc,6);
}

void BresenhamCircle(int xc,int yc,int r)
{
int x=0,y=r,d=3-(2*r);
EightWaySymmetricPlot(xc,yc,x,y);

while(x<=y)
{
if(d<=0)
{
d=d+(4*x)+6;
}
else
{
d=d+(4*x)-(4*y)+10;
y=y-1;
}
x=x+1;
EightWaySymmetricPlot(xc,yc,x,y);
}
}

int main(void)
{
/* request auto detection */
int xc,yc,r,gdriver = DETECT, gmode, errorcode;
/* initialize graphics and local variables */
initgraph(&gdriver, &gmode, "C:\\TURBOC3\\BGI");

/* read result of initialization */
errorcode = graphresult();

if (errorcode != grOk) /* an error occurred */
{
printf("Graphics error: %s\n", grapherrormsg(errorcode));
printf("Press any key to halt:");
getch();
exit(1); /* terminate with an error code */
}
printf("Enter the values of xc and yc :");
scanf("%d%d",&xc,&yc);
printf("Enter the value of radius :");
scanf("%d",&r);
BresenhamCircle(xc,yc,r);

getch();
closegraph();
return 0;
}


Output:

Bresenham's Circle Algorithm


MidPoint Circle Algorithm

It is based on the following function for testing the spatial relationship between the arbitrary point (x, y) and a circle of radius r centered at the origin:

MidPoint Circle Algorithm

MidPoint Circle Algorithm
Now, consider the coordinates of the point halfway between pixel T and pixel S

This is called midpoint (xi+1,yiMidPoint Circle Algorithm) and we use it to define a decision parameter:

Pi=f (xi+1,yiMidPoint Circle Algorithm) = (xi+1)2+(yiMidPoint Circle Algorithm)2-r2 ……………equation 2


If Pi is -ve ⟹midpoint is inside the circle and we choose pixel T

If Pi is+ve ⟹midpoint is outside the circle (or on the circle)and we choose pixel S.

The decision parameter for the next step is:

Pi+1=(xi+1+1)2+(yi+1MidPoint Circle Algorithm)2– r2…………equation 3

Since xi+1=xi+1, we have

MidPoint Circle Algorithm

If pixel T is choosen ⟹Pi<0

We have yi+1=yi

If pixel S is choosen ⟹Pi≥0

We have yi+1=yi-1

MidPoint Circle Algorithm
We can continue to simplify this in n terms of (xi,yi) and get

MidPoint Circle Algorithm
Now, initial value of Pi (0,r)from equation 2

MidPoint Circle Algorithm
We can put MidPoint Circle Algorithm≅1
∴r is an integer
So, P1=1-r

Algorithm:

Step1: Put x =0, y =r in equation 2
We have p=1-r

Step2: Repeat steps while x ≤ y
Plot (x, y)
If (p<0)
Then set p = p + 2x + 3
Else
p = p + 2(x-y)+5
y =y – 1 (end if)
x =x+1 (end loop)

Step3: End

Program to draw a circle using Midpoint Algorithm:

#include <graphics.h>
#include <stdlib.h>
#include <math.h>
#include <stdio.h>
#include <conio.h>
#include <iostream.h>

class bresen
{
float x, y,a, b, r, p;
public:
void get ();
void cal ();
};
void main ()
{
bresen b;
b.get ();
b.cal ();
getch ();
}
Void bresen :: get ()
{
cout<<"ENTER CENTER AND RADIUS";
cout<< "ENTER (a, b)";
cin>>a>>b;
cout<<"ENTER r";
cin>>r;
}
void bresen ::cal ()
{
/* request auto detection */
int gdriver = DETECT,gmode, errorcode;
int midx, midy, i;
/* initialize graphics and local variables */
initgraph (&gdriver, &gmode, " ");
/* read result of initialization */
errorcode = graphresult ();
if (errorcode ! = grOK) /*an error occurred */
{
printf("Graphics error: %s \n", grapherrormsg (errorcode);
printf ("Press any key to halt:");
getch ();
exit (1); /* terminate with an error code */
}
x=0;
y=r;
putpixel (a, b+r, RED);
putpixel (a, b-r, RED);
putpixel (a-r, b, RED);
putpixel (a+r, b, RED);
p=5/4)-r;
while (x<=y)
{
If (p<0)
p+= (4*x)+6;
else
{
p+=(2*(x-y))+5;
y--;
}
x++;
putpixel (a+x, b+y, RED);
putpixel (a-x, b+y, RED);
putpixel (a+x, b-y, RED);
putpixel (a+x, b+y, RED);
putpixel (a+x, b-y, RED);
putpixel (a-x, b+y, RED);
putpixel (a-x, b-y, RED);
}
}

Output:

MidPoint Circle Algorithm

Part 12: Hidden Surface Removal and 3D model projection

Part 3: Scan conversion on Circle using different Methods

Defining a Circle:

Circle is an eight-way symmetric figure. The shape of circle is the same in all quadrants. In each quadrant, there are two octants. If the calculation of the point of one octant is done, then the other seven points can be calculated easily by using the concept of eight-way symmetry. For drawing, circle considers it at the origin. If a point is P1(x, y), then the other seven points will be

Define a circle

Defining a Circle

So we will calculate only 45°arc. From which the whole circle can be determined easily. If we want to display circle on screen then the putpixel function is used for eight points as shown below:

putpixel (x, y, color)
putpixel (x, -y, color)
putpixel (-x, y, color)
putpixel (-x, -y, color)
putpixel (y, x, color)
putpixel (y, -x, color)
putpixel (-y, x, color)
putpixel (-y, -x, color)

Example: Let we determine a point (2, 7) of the circle then other points will be (2, -7), (-2, -7), (-2, 7), (7, 2), (-7, 2), (-7, -2), (7, -2)

These seven points are calculated by using the property of reflection. The reflection is accomplished in the following way:

The reflection is accomplished by reversing x, y co-ordinates.

Defining a Circle
There are two standards methods of mathematically defining a circle centered at the origin.

  1. Defining a circle using Polynomial Method
  2. Defining a circle using Polar Co-ordinates

Defining a circle using Polynomial Method:

The first method defines a circle with the second-order polynomial equation as shown in fig:

y2=r2-x2
Where x = the x coordinate
y = the y coordinate
r = the circle radius

With the method, each x coordinate in the sector, from 90° to 45°, is found by stepping x from 0 to Defining a circle using Polynomial Method & each  y coordinate is found by evaluatingDefining a circle using Polynomial Method Defining a circle using Polynomial Method for each step of x.

circle
Defining a circle using Polynomial Method Algorithm:

Step1: Set the initial variables
r = circle radius
(h, k) = coordinates of circle center
x=o
I = step size
xend= Defining a circle using Polynomial Method

Step2: Test to determine whether the entire circle has been scan-converted.

If x > xend then stop.
Step3: Compute y = Defining a circle using Polynomial Method

Step4: Plot the eight points found by symmetry concerning the center (h, k) at the current (x, y) coordinates.

Plot (x + h, y +k) Plot (-x + h, -y + k)
Plot (y + h, x + k) Plot (-y + h, -x + k)
Plot (-y + h, x + k) Plot (y + h, -x + k)
Plot (-x + h, y + k) Plot (x + h, -y + k)

Step5: Increment x = x + i

Step6: Go to step (ii).

Program to draw a circle using Polynomial Method:

#include<graphics.h>
#include<conio.h>
#include<math.h>
using namespace std;

void setPixel(int x, int y, int h, int k)
{
putpixel(x+h, y+k, RED);
putpixel(x+h, -y+k, RED);
putpixel(-x+h, -y+k, RED);
putpixel(-x+h, y+k, RED);
putpixel(y+h, x+k, RED);
putpixel(y+h, -x+k, RED);
putpixel(-y+h, -x+k, RED);
putpixel(-y+h, x+k, RED);
}
main()
{
int gd=0, gm,h,k,r;
double x,y,x2;
h=200, k=200, r=100;
initgraph(&gd, &gm, "C:\\TC\\BGI ");
setbkcolor(WHITE);
x=0,y=r;
x2 = r/sqrt(2);
while(x<=x2)
{
y = sqrt(r*r - x*x);
setPixel(floor(x), floor(y), h,k);
x += 1;
}
getch();
closegraph();
return 0;
}

OUTPUT

method


Defining a circle using Polar Co-ordinates :
The second method of defining a circle makes use of polar coordinates as shown in fig:

x=r cos θ y = r sin θ
Where θ=current angle
r = circle radius
x = x coordinate
y = y coordinate

By this method, θ is stepped from 0 to Defining a circle using Polar Co-ordinates & each value of x & y is calculated.

co-ordinates
Defining a circle using Polar Co-ordinates
Algorithm:
Step1: Set the initial variables:

r = circle radius
(h, k) = coordinates of the circle center
i = step size
θ_end=Defining a circle using Polar Co-ordinates
θ=0

Step2: If θ>θendthen stop.

Step3: Compute

x = r * cos θ y=r*sin?θ
Step4: Plot the eight points, found by symmetry i.e., the center (h, k), at the current (x, y) coordinates.

Plot (x + h, y +k) Plot (-x + h, -y + k)
Plot (y + h, x + k) Plot (-y + h, -x + k)
Plot (-y + h, x + k) Plot (y + h, -x + k)
Plot (-x + h, y + k) Plot (x + h, -y + k)

Step5: Increment θ=θ+i

Step6: Go to step (ii).

Program to draw a circle using Polar Coordinates:

#include <graphics.h>
#include <stdlib.h>
#define color 10
using namespace std;
void eightWaySymmetricPlot(int xc,int yc,int x,int y)
{
putpixel(x+xc,y+yc,color);
putpixel(x+xc,-y+yc,color);
putpixel(-x+xc,-y+yc,color);
putpixel(-x+xc,y+yc,color);
putpixel(y+xc,x+yc,color);
putpixel(y+xc,-x+yc,color);
putpixel(-y+xc,-x+yc,color);
putpixel(-y+xc,x+yc,color);
}
void PolarCircle(int xc,int yc,int r)
{
int x,y,d;
x=0;
y=r;
d=3-2*r;
eightWaySymmetricPlot(xc,yc,x,y);
while(x<=y)
{
if(d<=0)
{
d=d+4*x+6;
}
else
{
d=d+4*x-4*y+10;
y=y-1;
}
x=x+1;
eightWaySymmetricPlot(xc,yc,x,y);
}
}
int main(void)
{
int gdriver = DETECT, gmode, errorcode;
int xc,yc,r;
initgraph(&gdriver, &gmode, "c:\\turboc3\\bgi");
errorcode = graphresult();
if (errorcode != grOk)
{
printf("Graphics error: %s\n", grapherrormsg(errorcode));
printf("Press any key to halt:");
getch();
exit(1);
}
printf("Enter the values of xc and yc ,that is center points of circle : ");
scanf("%d%d",&xc,&yc);
printf("Enter the radius of circle : ");
scanf("%d",&r);
PolarCircle(xc,yc,r);
getch();
closegraph();
return 0;
}

Output:

cco-ordinates

Part 16: Artificial Intelligence with Deep Learning with Python

Part 16: Artificial Intelligence with Deep Learning with Python

Deep Learning

Deep learning emerged from a decade’s explosive computational growth as a serious contender in the field. Thus, deep learning is a particular kind of machine learning whose algorithms are inspired by the structure and function of human brain.

Machine Learning vs Deep Learning

Deep learning is the most powerful machine learning technique these days. It is so powerful because they learn the best way to represent the problem while learning how to solve the problem. A comparison of Deep learning and Machine learning is given below −

Data Dependency

The first point of difference is based upon the performance of DL and ML when the scale of data increases. When the data is large, deep learning algorithms perform very well.

Machine Dependency

Deep learning algorithms need high-end machines to work perfectly. On the other hand, machine learning algorithms can work on low-end machines too.

Feature Extraction

Deep learning algorithms can extract high level features and try to learn from the same too. On the other hand, an expert is required to identify most of the features extracted by machine learning.

Time of Execution

Execution time depends upon the numerous parameters used in an algorithm. Deep learning has more parameters than machine learning algorithms. Hence, the execution time of DL algorithms, specially the training time, is much more than ML algorithms. But the testing time of DL algorithms is less than ML algorithms.

Approach to Problem Solving

Deep learning solves the problem end-to-end while machine learning uses the traditional way of solving the problem i.e. by breaking down it into parts.

[wpsbx_html_block id=1891]

Convolutional Neural Network (CNN)

Convolutional neural networks are the same as ordinary neural networks because they are also made up of neurons that have learnable weights and biases. Ordinary neural networks ignore the structure of input data and all the data is converted into 1-D array before feeding it into the network. This process suits the regular data, however if the data contains images, the process may be cumbersome.

CNN solves this problem easily. It takes the 2D structure of the images into account when they process them, which allows them to extract the properties specific to images. In this way, the main goal of CNNs is to go from the raw image data in the input layer to the correct class in the output layer. The only difference between an ordinary NNs and CNNs is in the treatment of input data and in the type of layers.

Architecture Overview of CNNs

Architecturally, the ordinary neural networks receive an input and transform it through a series of hidden layer. Every layer is connected to the other layer with the help of neurons. The main disadvantage of ordinary neural networks is that they do not scale well to full images.

The architecture of CNNs have neurons arranged in 3 dimensions called width, height and depth. Each neuron in the current layer is connected to a small patch of the output from the previous layer. It is similar to overlaying a 𝑵×𝑵 filter on the input image. It uses M filters to be sure about getting all the details. These M filters are feature extractors which extract features like edges, corners, etc.

Layers used to construct CNNs

Following layers are used to construct CNNs −

  • Input Layer − It takes the raw image data as it is.
  • Convolutional Layer − This layer is the core building block of CNNs that does most of the computations. This layer computes the convolutions between the neurons and the various patches in the input.
  • Rectified Linear Unit Layer − It applies an activation function to the output of the previous layer. It adds non-linearity to the network so that it can generalize well to any type of function.
  • Pooling Layer − Pooling helps us to keep only the important parts as we progress in the network. Pooling layer operates independently on every depth slice of the input and resizes it spatially. It uses the MAX function.
  • Fully Connected layer/Output layer − This layer computes the output scores in the last layer. The resulting output is of the size 𝟏×𝟏×𝑳 , where L is the number training dataset classes.

Installing Useful Python Packages

You can use Keras, which is an high level neural networks API, written in Python and capable of running on top of TensorFlow, CNTK or Theno. It is compatible with Python 2.7-3.6. You can learn more about it from https://keras.io/.

Use the following commands to install keras −

pip install keras

On conda environment, you can use the following command −

conda install –c conda-forge keras

Building Linear Regressor using ANN

In this section, you will learn how to build a linear regressor using artificial neural networks. You can use KerasRegressor to achieve this. In this example, we are using the Boston house price dataset with 13 numerical for properties in Boston. The Python code for the same is shown here −

Import all the required packages as shown −

import numpy
import pandas
from keras.models import Sequential
from keras.layers import Dense
from keras.wrappers.scikit_learn import KerasRegressor
from sklearn.model_selection import cross_val_score
from sklearn.model_selection import KFold

Now, load our dataset which is saved in local directory.

dataframe = pandas.read_csv("/Usrrs/admin/data.csv", delim_whitespace = True, header = None)
dataset = dataframe.values

Now, divide the data into input and output variables i.e. X and Y −

X = dataset[:,0:13]
Y = dataset[:,13]

Since we use baseline neural networks, define the model −

def baseline_model():

Now, create the model as follows −

model_regressor = Sequential()
model_regressor.add(Dense(13, input_dim = 13, kernel_initializer = 'normal', 
   activation = 'relu'))
model_regressor.add(Dense(1, kernel_initializer = 'normal'))

Next, compile the model −

model_regressor.compile(loss='mean_squared_error', optimizer='adam')
return model_regressor

Now, fix the random seed for reproducibility as follows −

seed = 7
numpy.random.seed(seed)

The Keras wrapper object for use in scikit-learn as a regression estimator is called KerasRegressor. In this section, we shall evaluate this model with standardize data set.

estimator = KerasRegressor(build_fn = baseline_model, nb_epoch = 100, batch_size = 5, verbose = 0)
kfold = KFold(n_splits = 10, random_state = seed)
baseline_result = cross_val_score(estimator, X, Y, cv = kfold)
print("Baseline: %.2f (%.2f) MSE" % (Baseline_result.mean(),Baseline_result.std()))

The output of the code shown above would be the estimate of the model’s performance on the problem for unseen data. It will be the mean squared error, including the average and standard deviation across all 10 folds of the cross validation evaluation.

Image Classifier: An Application of Deep Learning

Convolutional Neural Networks (CNNs) solve an image classification problem, that is to which class the input image belongs to. You can use Keras deep learning library. Note that we are using the training and testing data set of images of cats and dogs from following link https://www.kaggle.com/c/dogs-vs-cats/data.

Import the important keras libraries and packages as shown −

The following package called sequential will initialize the neural networks as sequential network.

from keras.models import Sequential

The following package called Conv2D is used to perform the convolution operation, the first step of CNN.

from keras.layers import Conv2D

The following package called MaxPoling2D is used to perform the pooling operation, the second step of CNN.

from keras.layers import MaxPooling2D

The following package called Flatten is the process of converting all the resultant 2D arrays into a single long continuous linear vector.

from keras.layers import Flatten

The following package called Dense is used to perform the full connection of the neural network, the fourth step of CNN.

from keras.layers import Dense

Now, create an object of the sequential class.

S_classifier = Sequential()

Now, next step is coding the convolution part.

S_classifier.add(Conv2D(32, (3, 3), input_shape = (64, 64, 3), activation = 'relu'))

Here relu is the rectifier function.

Now, the next step of CNN is the pooling operation on the resultant feature maps after convolution part.

S-classifier.add(MaxPooling2D(pool_size = (2, 2)))

Now, convert all the pooled images into a continuous vector by using flattering −

S_classifier.add(Flatten())

Next, create a fully connected layer.

S_classifier.add(Dense(units = 128, activation = 'relu'))

Here, 128 is the number of hidden units. It is a common practice to define the number of hidden units as the power of 2.

Now, initialize the output layer as follows −

S_classifier.add(Dense(units = 1, activation = 'sigmoid'))

Now, compile the CNN, we have built −

S_classifier.compile(optimizer = 'adam', loss = 'binary_crossentropy', metrics = ['accuracy'])

Here optimizer parameter is to choose the stochastic gradient descent algorithm, loss parameter is to choose the loss function and metrics parameter is to choose the performance metric.

Now, perform image augmentations and then fit the images to the neural networks −

train_datagen = ImageDataGenerator(rescale = 1./255,shear_range = 0.2,
zoom_range = 0.2,
horizontal_flip = True)
test_datagen = ImageDataGenerator(rescale = 1./255)

training_set = 
   train_datagen.flow_from_directory(”/Users/admin/training_set”,target_size = 
      (64, 64),batch_size = 32,class_mode = 'binary')

test_set = 
   test_datagen.flow_from_directory('test_set',target_size = 
      (64, 64),batch_size = 32,class_mode = 'binary')

Now, fit the data to the model we have created −

classifier.fit_generator(training_set,steps_per_epoch = 8000,epochs = 
25,validation_data = test_set,validation_steps = 2000)

Here steps_per_epoch have the number of training images.

Now as the model has been trained, we can use it for prediction as follows −

from keras.preprocessing import image

test_image = image.load_img('dataset/single_prediction/cat_or_dog_1.jpg', 
target_size = (64, 64))

test_image = image.img_to_array(test_image)

test_image = np.expand_dims(test_image, axis = 0)

result = classifier.predict(test_image)

training_set.class_indices

if result[0][0] == 1:
prediction = 'dog'

else:
   prediction = 'cat'