by Jesmin Akther | Aug 31, 2021 | Computer Graphics
Three Dimensional Graphics
The 2D can show two-dimensional objects. Like the Bar chart, pie chart, graphs. But some more natural objects can be represented using 3D. Using 3D, we can see different shapes of the object in different sections. In 3D when a translation is done we need three factors for rotation also, it is a component of three rotations. Each can be performed along any three Cartesian axis. In 3D also we can represent a sequence of transformations as a single matrix. Computer Graphics uses CAD. CAD allows manipulation of machine components which are 3 Dimensional. It also provides automobile bodies, aircraft parts study. All these activities require realism. For realism 3D is required. In the production of a realistic 3D scene from 2D is tough. It require three dimension, i.e., depth.
3D Geometry
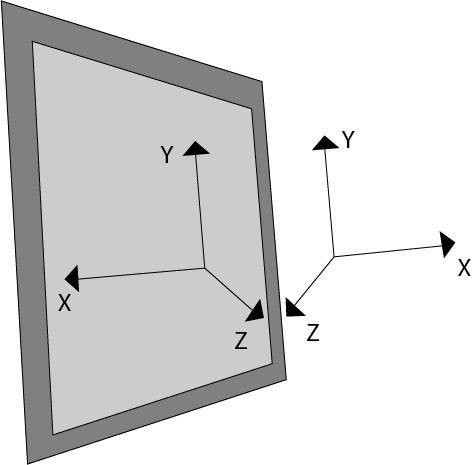
Three dimension system has three axis x, y, z. The orientation of a 3D coordinate system is of two types. Right-handed system and left-handed system. In the right -handed system thumb of right- hand points to positive z-direction and left- hand system thumb point to negative two directions. Following figure show right-hand orientation of the cube.
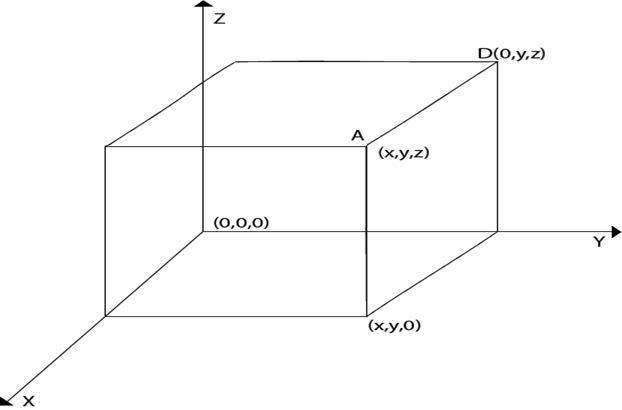
Using right-handed system co-ordinates of corners A, B, C, D of the cube
Point A x, y, z
Point B x, y, 0
Point C 0, y, 0
Point D 0, y, z
Producing realism in 3D:
The three-dimensional objects are made using computer graphics. The technique used for two Dimensional displays of three Dimensional objects is called projection. Several types of projection are available, i.e.,
- Parallel Projection
- Perspective Projection
- Orthographic Projection
1. Parallel Projection:
In this projection point on the screen is identified within a point in the three-dimensional object by a line perpendicular to the display screen. The architect Drawing, i.e., plan, front view, side view, elevation are nothing but lines of parallel projections.
2. Perspective Projection:
This projection has a property that it provides idea about depth. Farther the object from the viewer, smaller it will appear. All lines in perspective projection converge at a center point called as the center of projection.
3. Orthographic Projection: It is simplest kind of projection. In this, we take a top, bottom, side view of the object by extracting parallel lines from the object.
Three Dimensional Models
The techniques for generating different images of a solid object depend upon the type of object. Two viewing techniques are available for viewing three-dimensional objects.
- Geometry: It is concerned with measurements. Measurement is the location of a point concerning origin or dimension of an object.
- Topological Information: It is used for the structure of a solid object. It is mainly concerned with the formation of polygons with the help of points of objects or the creation of the object with polygons.
Three Dimensional Transformations
The geometric transformations play a vital role in generating images of three Dimensional objects with the help of these transformations. The location of objects relative to others can be easily expressed. Sometimes viewpoint changes rapidly, or sometimes objects move in relation to each other. For this number of transformation can be carried out repeatedly.
Translation
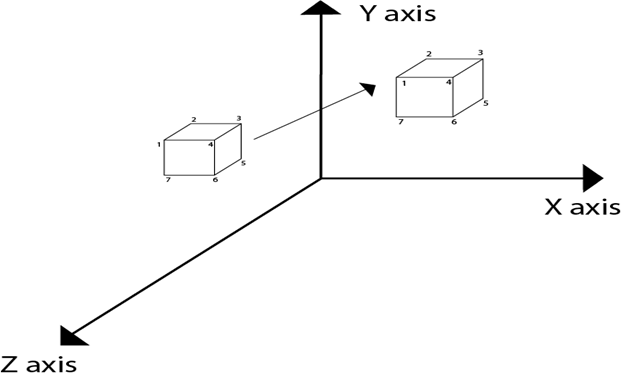
It is the movement of an object from one position to another position. Translation is done using translation vectors. There are three vectors in 3D instead of two. These vectors are in x, y, and z directions. Translation in the x-direction is represented using Tx. The translation is y-direction is represented using Ty. The translation in the z- direction is represented using Tz.
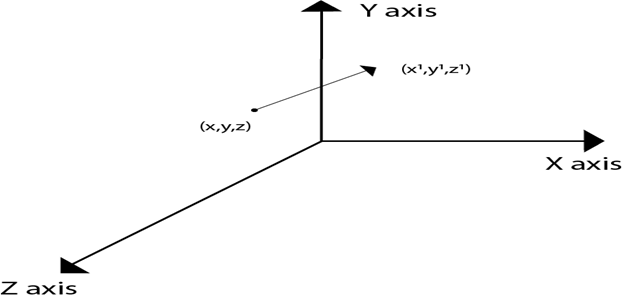
If P is a point having co-ordinates in three directions (x, y, z) is translated, then after translation its coordinates will be (x1 y1 z1) after translation. Tx Ty Tz are translation vectors in x, y, and z directions respectively.
x1=x+ Tx
y1=y+Ty
z1=z+ Tz
Three-dimensional transformations are performed by transforming each vertex of the object. If an object has five corners, then the translation will be accomplished by translating all five points to new locations. Following figure 1 shows the translation of point figure 2 shows the translation of the cube.
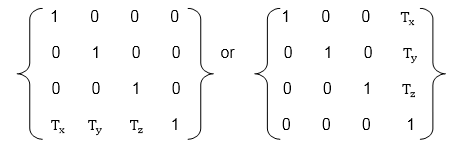
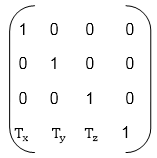
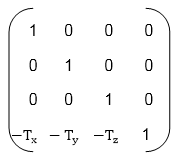
Matrix for translation
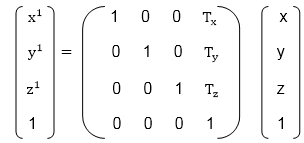
Matrix representation of point translation
Point shown in fig is (x, y, z). It become (x1,y1,z1) after translation. Tx Ty Tz are translation vector.
Example:
A point has coordinates in the x, y, z direction i.e., (5, 6, 7). The translation is done in the x-direction by 3 coordinate and y direction. Three coordinates and in the z- direction by two coordinates. Shift the object. Find coordinates of the new position.
Solution: Co-ordinate of the point are (5, 6, 7)
Translation vector in x direction = 3
Translation vector in y direction = 3
Translation vector in z direction = 2
Translation matrix is
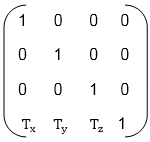
Multiply co-ordinates of point with translation matrix
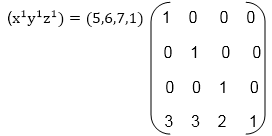
= [5+0+0+30+6+0+30+0+7+20+0+0+1] = [8991]
x becomes x1=8
y becomes y1=9
z becomes z1=9
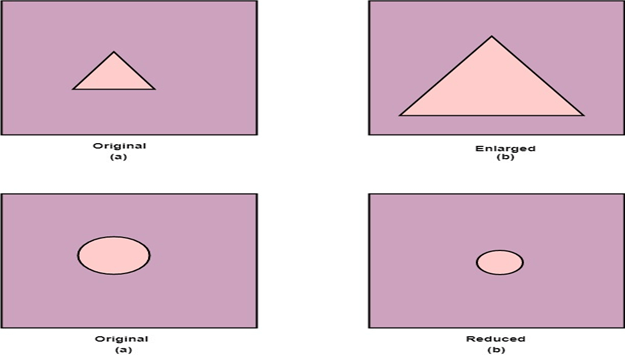
Scaling
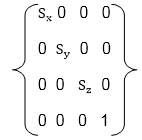
Scaling is used to change the size of an object. The size can be increased or decreased. The scaling three factors are required Sx Sy and Sz.
Sx=Scaling factor in x- direction
Sy=Scaling factor in y-direction
Sz=Scaling factor in z-direction
Matrix for Scaling
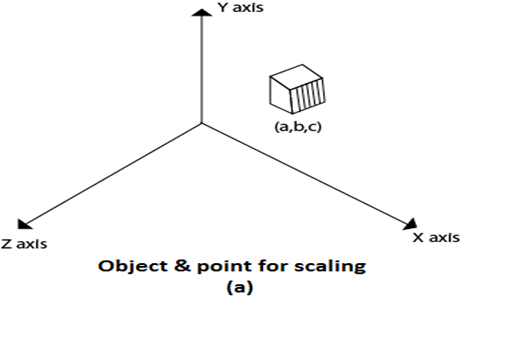
Scaling of the object relative to a fixed point
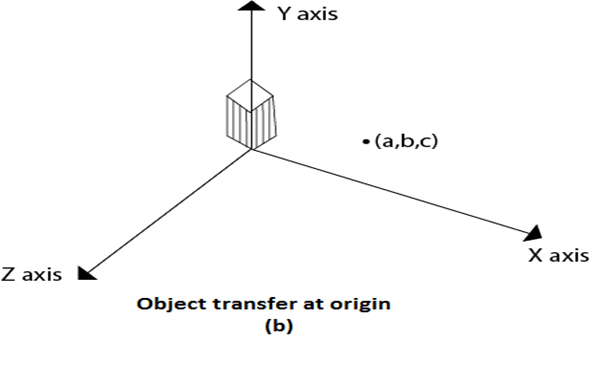
Following are steps performed when scaling of objects with fixed point (a, b, c). It can be represented as below:
- Translate fixed point to the origin
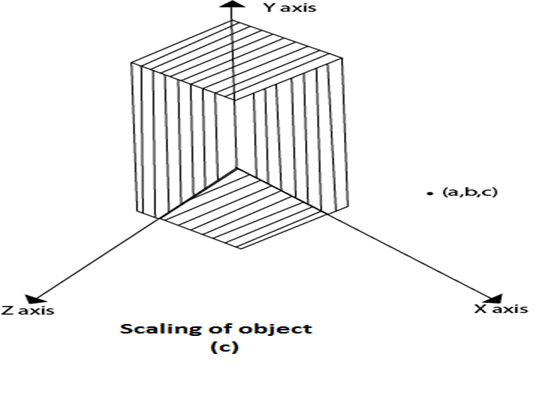
- Scale the object relative to the origin
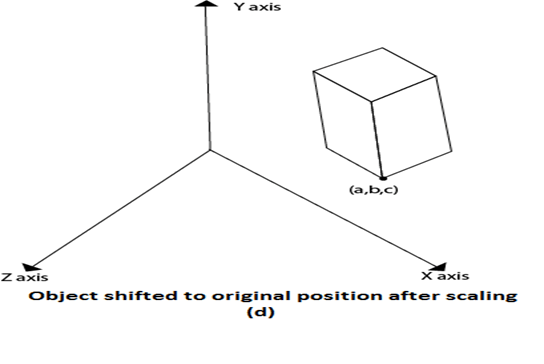
- Translate object back to its original position.
In figure (a) point (a, b, c) is shown, and object whose scaling is to done also shown in steps in fig (b), fig (c) and fig (d).
Scaling
Scaling is used to change the size of an object. The size can be increased or decreased. The scaling three factors are required Sx Sy and Sz.
Sx=Scaling factor in x- direction
Sy=Scaling factor in y-direction
Sz=Scaling factor in z-direction
Matrix for Scaling
Scaling of the object relative to a fixed point
Following are steps performed when scaling of objects with fixed point (a, b, c). It can be represented as below:
- Translate fixed point to the origin
- Scale the object relative to the origin
- Translate object back to its original position.
In figure (a) point (a, b, c) is shown, and object whose scaling is to done also shown in steps in fig (b), fig (c) and fig (d).
Inverse Transformations
These are also called as opposite transformations. If T is a translation matrix than inverse translation is representing using T-1. The inverse matrix is achieved using the opposite sign.
Example1: Translation and its inverse matrix
Translation matrix
Inverse translation matrix
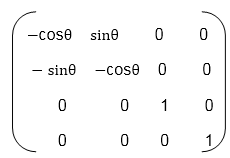
Example2: Rotation and its inverse matrix
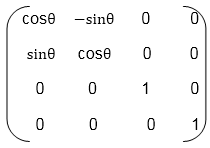
Inverse Rotation Matrix
Reflection
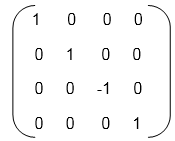
It is also called a mirror image of an object. For this reflection axis and reflection of plane is selected. Three-dimensional reflections are similar to two dimensions. Reflection is 180° about the given axis. For reflection, plane is selected (xy,xz or yz). Following matrices show reflection respect to all these three planes.
Reflection relative to XY plane
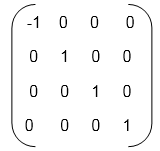
Reflection relative to YZ plane
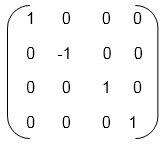
Reflection relative to ZX plane
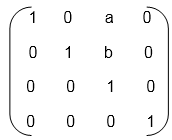
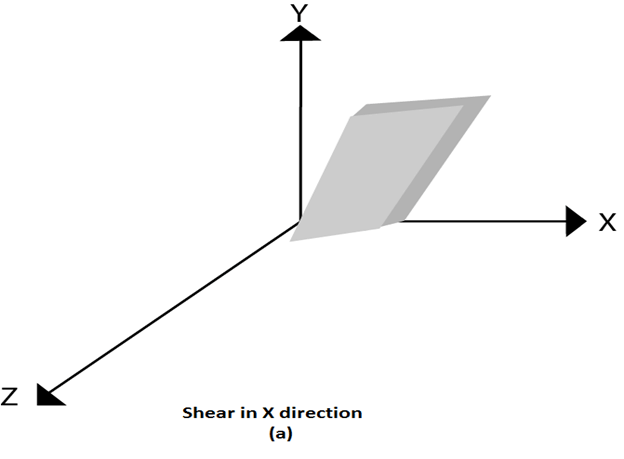
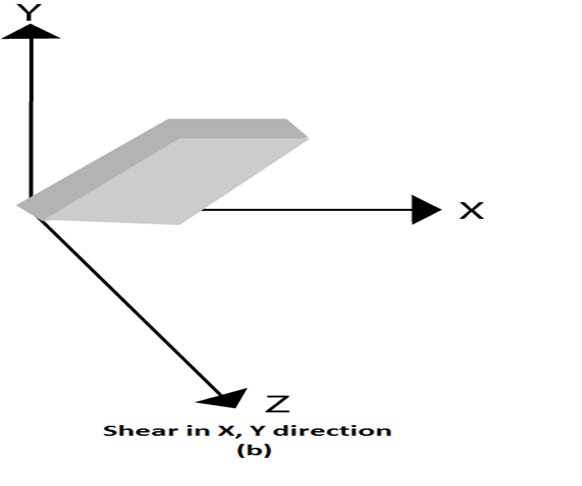
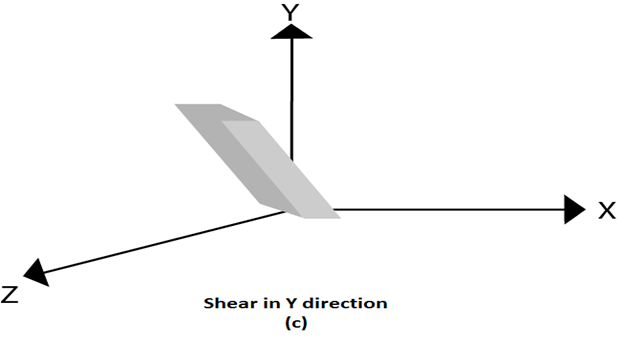
Shearing
It is change in the shape of the object. It is also called as deformation. Change can be in the x -direction or y -direction or both directions in case of 2D. If shear occurs in both directions, the object will be distorted. But in 3D shear can occur in three directions.
Matrix for shear
by Jesmin Akther | Aug 31, 2021 | Computer Graphics
Pointing and Positioning Techniques
Pointing technique refers to look at the items already on the screen whereas the positioning technique refers to position the item on the screen to a new position, i.e., the old current position. The user indicates a position on the screen with an input device, and this position is used to insert a symbol.
There are various pointing and positioning devices which are discussed below:
- Light Pen
- Mouse
- Tablet
- Joystick
- Trackball and spaceball
1. Light Pen:
It is a pointing device. When light pen is pointed at an item on the screen, it generates information from which the item can be identified by the program. It does not have any associated tracking hardware instead tracking is performed by software, making use of the output function of the display. All light pen programs depend on a rapid response from the pen when it is pointed at the screen fast response light pens can be build by using a highly sensitive photocell such as a photomultiplier tube.
2. Mouse:
It is a positioning device which consists of a small plastic box resting on two metal wheels whose axes are at right angles. Each wheel of the mouse is linked to a shaft encoder that delivers an electrical pulse for every incremental rotation of the wheel. As the mouse is rolled around on a flat surface, its movement in two orthogonal directions is translated into rotation of the wheels. These rotations can be measured by counting the pulses received from the shaft encoders. The connected values may be held in registers accessible to the computer on written directly into the computer memory. It is simple and low cost, and there is no need to pick it up to use it. The mouse sits on the table surface. But the mouse cannot be used for tracing data from paper since a small rotation of the mouse will cause an error in all the reading and it is complicated handprint character for recognition by the computer.
3. Tablet: It is also a positioning device and is used to describe a flat surface separate from the display, on which the user draws with a stylus. There are two types of tablets:
- Acoustic Tablet:
It depends on the use of strip microphones which are mounted along two adjacent edges of the tablet. The styles have a small piece of ceramic mounted close to its tip, and at regular intervals, a small spark is generated across the surface of the ceramic between two electrodes. The microphones pick up the pulse of sound produced by the spark and two counters record the delay between creating the spark and receiving the sound. These two delays are proportional to the stylus distance from the two edges of the tablet where the microphones are mounted.
- Electro-acoustic Tablet:
In this technique, the writing surface is a sheet of magneto strictive material acting as a row of delay lines. An electric pulse travels through the sheet first horizontally and then vertically and is detected by a sensor in the stylus. A counter is used to determine the delay from the time the pulse is issued to the time it is detected; from this value, the position of the stylus can be determined. The electro-acoustic tablet is quieter in operation than its acoustic counterpart and is less affected by noise or air movement.
4. Joystick:
A joystick consists of a small that is used to steer the screen cursor around. The distance that the stick is moved in any direction from its center position corresponds to the screen-cursor movement in that direction. Pressure sensitive joysticks have a non-moveable stick. Pressure on the stick is measured with strain gauges and converted to the movement of the cursor in the direction specified.
5. Trackball and spaceball:
Trackball is a ball that can be rotated with the fingers to produces screen-cursor movement potentiometers, attached to the ball, measure the amount and direction of rotation. Trackballs are after mounted on keyboards, whereas space-ball provides six degrees of freedom. Spaceballs is used for three-dimensional positioning and selection operation in virtual reality system, modeling, animation, CAD and other applications.
Elastic or Rubber Band Techniques
- Rubber banding is a popular technique of drawing geometric primitives such as line, polylines, rectangle, circle and ellipse on the computer screen.
- It becomes an integral part and de facto standard with the graphical user interface (GUI) for drawing and is almost universally accepted by all windows based applications.
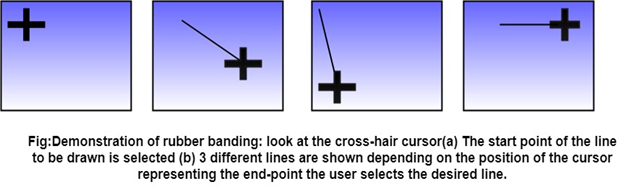
- The user specifies the line in the usual way by positioning its two endpoints. As we move from the first endpoint to the second, the program displays a line from the first endpoint to the cursor position, thus he can see the lie of the line before he finishes positioning it.
- The effect is of an elastic line stretched between the first endpoint and the cursor; hence the name for these techniques.
Consider the different linear structures in fig (a) and fig (d), depending on the position of the cross-hair cursor. The user may move the cursor to generate more possibilities and select the one which suits him for a specific application.
Selection of Terminal Point of the Line:
- The user moves the cursor to the appropriate position and selects.
- Then, as the cursor is moved, the line changes taking the latest positions of the cursors as the end-point.
- As long as the button is held down, the state of the rubber band is active.
The process is explained with the state transition diagram of rubber banding in fig:
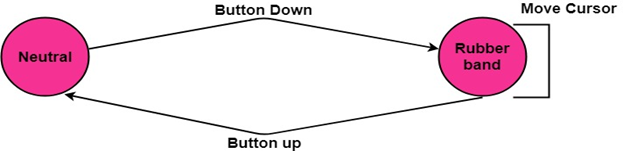
When the user is happy with the final position, the pressed button is released, and the line is drawn between the start and the last position of the cursor.
Example: This is widely followed in MS-Window based Applications like in the case of a paintbrush drawing package.
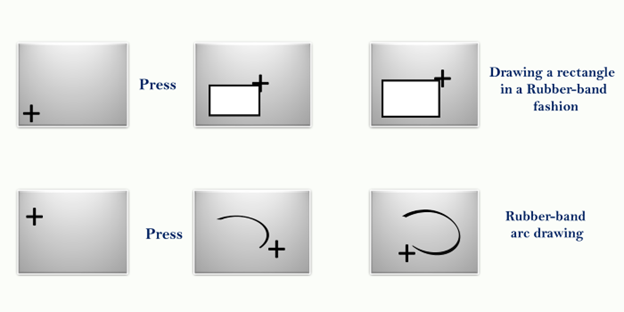
Other geometric entities can be drawn in a rubber-band fashion:
- Horizontally or vertically constructed lines
- Rectangles
- Arcs of circles
This technique is very helpful in drawing relatively complex entities such as rectangles and arcs.
Advantage:
- It is used for drawing all geometric entities such as line, polygon, circle, rectangle, ellipse, and other curves.
- It is easy to understand and implement.
Disadvantage:
- It requires computational resources like software and CPU speed.
- Expensive
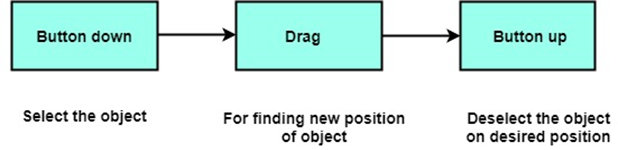
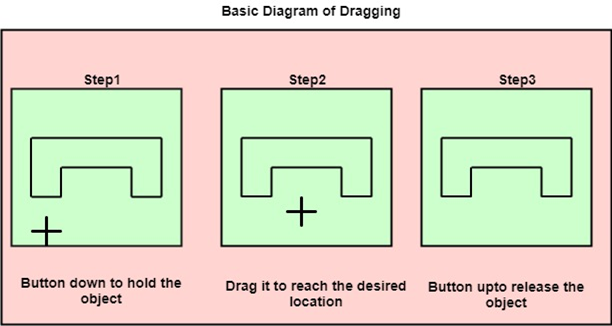
Dragging
Dragging is used to move an object from one position to another position on the computer screen. To drag any other object, first, we have to select the object that we want to move on the screen by holding the mouse button down. As cursor moved on the screen, the object is also moved with the cursor position. When the cursor reached the desired position, the button is released.
The following diagram represents the dragging procedure:
Animation
Animation refers to the movement on the screen of the display device created by displaying a sequence of still images. Animation is the technique of designing, drawing, making layouts and preparation of photographic series which are integrated into the multimedia and gaming products. Animation connects the exploitation and management of still images to generate the illusion of movement. A person who creates animations is called animator. He/she use various computer technologies to capture the pictures and then to animate these in the desired sequence. Animation includes all the visual changes on the screen of display devices. These are:
1. Change of shape as smile, sad and angry etc emoticon.
2. Change in size as very small circle, larger circle and biggest circle etc.
3. Change in color select red unselect white.
4. Change in structure as rotate a triangle.
5. Change in angle as counter clockwise and antilock wise:
Application Areas of Animation
1. Education and Training:
Animation is used in school, colleges and training centers for education purpose. Flight simulators for aircraft are also animation based.
2. Entertainment:
Animation methods are now commonly used in making motion pictures, music videos and television shows, etc.
3. Computer Aided Design (CAD):
One of the best applications of computer animation is Computer Aided Design and is generally referred to as CAD. One of the earlier applications of CAD was automobile designing. But now almost all types of designing are done by using CAD application, and without animation, all these work can’t be possible.
4. Advertising:
This is one of the significant applications of computer animation. The most important advantage of an animated advertisement is that it takes very less space and capture people attention.
5. Presentation:
Animated Presentation is the most effective way to represent an idea. It is used to describe financial, statistical, mathematical, scientific & economic data.
Animation Functions
1. Morphing:
Morphing is an animation function which is used to transform object shape from one form to another is called Morphing. It is one of the most complicated transformations. This function is commonly used in movies, cartoons, advertisement, and computer games. Example: Face App make one younger image into older.
The process of Morphing involves three steps:
- In the first step, one initial image and other final image are added to morphing application as shown in fig: Ist & 4th object consider as key frames.
- The second step involves the selection of key points on both the images for a smooth transition between two images as shown in 2nd object.
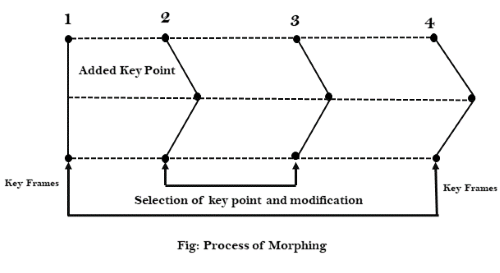
3. In the third step, the key point of the first image transforms to a corresponding key point of the second image as shown in 3rd object of the figure.
2. Wrapping:
Wrapping function is similar to morphing function. It distorts only the initial images so that it matches with final images and no fade occurs in this function.
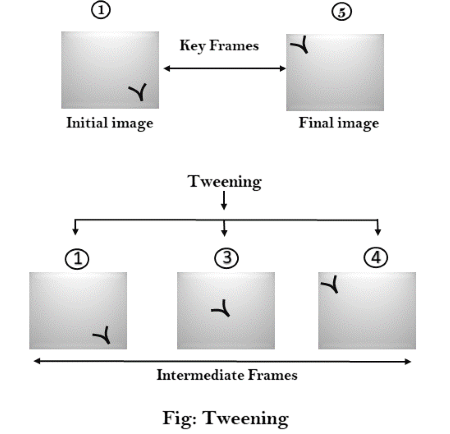
3. Tweening:
Tweening is the short form of ‘inbetweening.’ Tweening is the process of generating intermediate frames between the initial & last final images. This function is popular in the film industry.
4. Panning:
Usually Panning refers to rotation of the camera in horizontal Plane. In computer graphics, Panning relates to the movement of fixed size window across the window object in a scene. In which direction the fixed sized window moves, the object appears to move in the opposite direction as human walk but the moon in fix plane but seem to us moving with us. Another example running car and rain.
If the window moves in a backward direction, then the object appear to move in the forward direction and the window moves in forward direction then the object appear to move in a backward direction.
5. Zooming:
In zooming, the window is fixed an object and change its size, the object also appear to change in size. When the window is made smaller about a fixed center, the object comes inside the window appear more enlarged. This feature is known as Zooming In.
When we increase the size of the window about the fixed center, the object comes inside the window appear small. This feature is known as Zooming Out.
6. Fractals:
Fractal Function is used to generate a complex picture by using Iteration. Iteration means the repetition of a single formula again & again with slightly different value based on the previous iteration result. These results are displayed on the screen in the form of the display picture.
by Jesmin Akther | Aug 25, 2021 | Computer Graphics
Introduction of Computer Graphics
Generally, it is difficult to display an image of any size on the computer screen. This method is simplified by using Computer graphics. Graphics on the computer are produced by using various algorithms and techniques. This tutorial describes how a rich visual experience is provided to the user by explaining how all these processed by the computer. It involves technology to access. The Process transforms and presents information in a visual form. The role of computer graphics insensible. In today life, computer graphics has now become a common element in user interfaces, T.V. commercial motion pictures. Computer Graphics is the creation of pictures with the help of a computer. The end product of the computer graphics is a picture it may be a business graph, drawing, and engineering. In computer graphics, two or three-dimensional pictures can be created that are used for research. Many hardware devices algorithm has been developing for improving the speed of picture generation with the passes of time. It includes the creation storage of models and image of objects. These models for various fields like engineering, mathematical and so on.
Definition of Computer Graphics:
It is the use of computers to create and manipulate pictures on a display device. It comprises of software techniques to create, store, modify, represents pictures.
Why computer graphics used?
Suppose a shoe manufacturing company want to show the sale of shoes for five years. For this vast amount of information is to store. So a lot of time and memory will be needed. This method will be tough to understand by a common man. In this situation graphics is a better alternative. Graphics tools are charts and graphs. Using graphs, data can be represented in pictorial form. A picture can be understood easily just with a single look. Interactive computer graphics work using the concept of two-way communication between computer users. The computer will receive signals from the input device, and the picture is modified accordingly. Picture will be changed quickly when we apply command.
Types of Computer Graphics
Raster Graphics: In raster graphics pixels are used for an image to be drawn. It is also known as a bitmap image in which a sequence of image is into smaller pixels. Basically a bitmap indicates a large number of pixels together.
Vector Graphics: In vector graphics, mathematical formulae are used to draw different types of shapes, lines, objects and so on.
Computer Graphics Applications:
- Computer Art: MS Paint.
- Presentation Graphics : It is used to summarize financial statistical scientific or economic data. For example- Bar chart, Line chart.
- Entertainment: It is used in motion picture, music video, television gaming.
- Education and training: It is used to understand operations of complex system. It is also used for specialized system such for framing for captains, pilots and so on.
- Visualization: To study trends and patterns. For example: Analyzing satellite photo of earth.
- Computer graphics user interfaces GUIs :A graphic, mouse-oriented paradigm which allows the user to interact with a computer. For engineering and architectural system, these are used in electrical automobile, electro-mechanical, mechanical, electronic devices. For example: gears and bolts.
- Business presentation graphics :A picture is worth a thousand words”.
- Cartography: Drawing maps.
- Weather Maps :Real-time mapping, symbolic representations.
- Satellite Imaging: Geodesic images.
- Photo Enhancement: Sharpening blurred photos.
- Medical imaging :MRIs, CAT scans, etc. – Non-invasive internal examination.
- Engineering drawings: mechanical, electrical, civil, etc. – Replacing the blueprints of the past.
- Typography: The use of character images in publishing – replacing the hard type of the past.
- Architecture :Construction plans, exterior sketches – replacing the blueprints and hand drawings of the past.
- Art: Computers provide a new medium for artists.
- Training: Flight simulators, computer aided instruction, etc.
- Simulation and modeling: Replacing physical modeling and enactments
Cathode Ray Tube
The video monitor is primary output device in a graphical system. The main element of a video monitor is the Cathode Ray Tube CRTCRT, shown in the following illustration.
The operation of CRT is very simple:
- The electron gun emits a beam of electrons cathode rays.
- The electron beam passes through focusing and deflection systems that direct it towards specified positions on the phosphor coated screen.
- When the beam hits the screen, the phosphor emits a small spot of light at each position contacted by the electron beam.
- It redraws the picture by directing the electron beam back over the same screen points quickly.
There are two ways Random scan and Raster scan by which we can display an object on the screen.
Raster Scan
In a raster scan system, the electron beam is swept across the screen, one row at a time from top to bottom. As the electron beam moves across each row, the beam intensity is turned on and off to create a
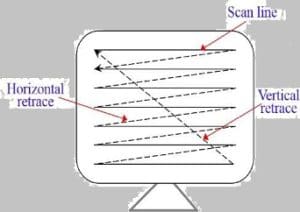 pattern of illuminated spots.
Picture definition is stored in memory area called the Refresh Buffer or Frame Buffer. This memory area holds the set of intensity values for all the screen points. Stored intensity values are then retrieved from the refresh buffer and “painted” on the screen one row scanline at a time as shown in the following illustration. Each screen point is referred to as a pixel picture element or pel. At the end of each scan line, the electron beam returns to the left side of the screen to begin displaying the next scan line.
Random Scan Vector Scan
In this technique, the electron beam is directed only to the part of the screen where the picture is to be drawn rather than scanning from left to right and top to bottom as in raster scan. It is also called vector display, stroke-writing display, or calligraphic display. Picture definition is stored as a set of line-drawing commands in an area of memory referred to as the refresh display file. To display a specified picture, the system cycles through the set of commands in the display file, drawing each component line in turn. After all the line-drawing commands are processed, the system cycles back to the first line command in the list. Random-scan displays are designed to draw all the component lines of a picture 30 to 60 times each second.
Scan Conversion
Scan Conversion is a process of representing graphics objects a collection of pixels. The graphics objects are continuous. The pixels used are discrete. Each pixel can have either on or off state. The circuitry of the video display device of the computer is capable of converting binary values (0, 1) into a pixel on and pixel off information. 0 is represented by pixel off. 1 is represented using pixel on. Using this ability graphics computer represent picture having discrete dots. Any model of graphics can be reproduced with a dense matrix of dots or points. Most human beings think graphics objects as points, lines, circles, ellipses. For generating graphical object, many algorithms have been developed. Examples of objects which can be scan
- converted
- Point
- Line
- Sector
- Arc
- Ellipse
- Rectangle
- Polygon
- Characters
- Filled Regions
The process of converting is also called as rasterization. The algorithms implementation varies from one computer system to another computer system. Some algorithms are implemented using the software, hardware or firmware.
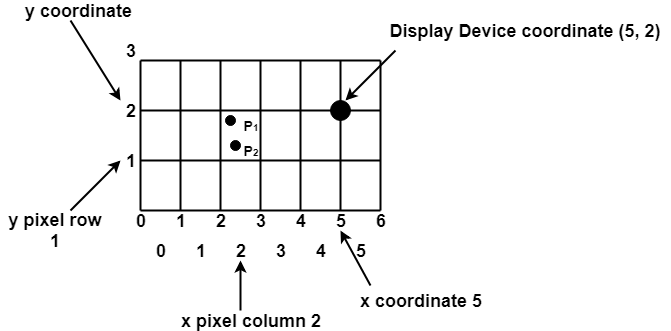
Pixel or Pel:
pixel is a short form of the picture element. that is also called a point or dot. It is the smallest picture unit accepted by display devices. A picture is constructed from hundreds of such pixels. Pixels are generated using commands. Lines, circle, arcs, characters; curves are drawn with closely spaced pixels. In order to display the digit or letter matrix of pixels is used.
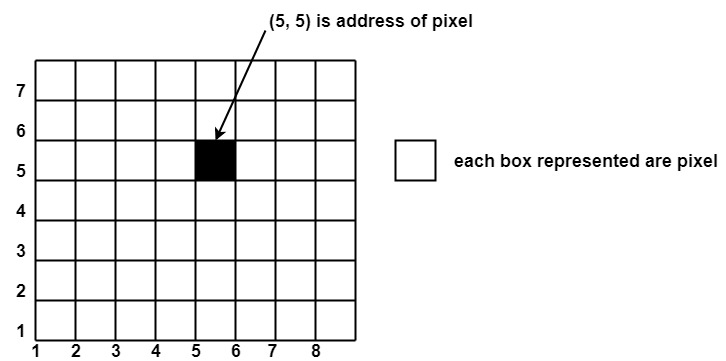
The coordinate is represented using row and column. P (5, 5) used to represent a pixel in the 5th row and the 5th column. Each pixel has some intensity value which is represented in memory of computer called a frame buffer. Frame Buffer is also called a refresh buffer.
Scan Converting a Point
Each pixel on the graphics display does not represent a mathematical point. Rather, it means a region which theoretically can contain an infinite number of points. Scan-Converting a point involves illuminating the pixel that contains the point.
Example: Display coordinates points  as shown in fig would both be represented by pixel (2, 1). In general, a point p (x, y) is represented by the integer part of x & the integer part of y that is pixels [(INT (x), INT (y).