Introduction of Computer Graphics
Generally, it is difficult to display an image of any size on the computer screen. This method is simplified by using Computer graphics. Graphics on the computer are produced by using various algorithms and techniques. This tutorial describes how a rich visual experience is provided to the user by explaining how all these processed by the computer. It involves technology to access. The Process transforms and presents information in a visual form. The role of computer graphics insensible. In today life, computer graphics has now become a common element in user interfaces, T.V. commercial motion pictures. Computer Graphics is the creation of pictures with the help of a computer. The end product of the computer graphics is a picture it may be a business graph, drawing, and engineering. In computer graphics, two or three-dimensional pictures can be created that are used for research. Many hardware devices algorithm has been developing for improving the speed of picture generation with the passes of time. It includes the creation storage of models and image of objects. These models for various fields like engineering, mathematical and so on.
Definition of Computer Graphics:
It is the use of computers to create and manipulate pictures on a display device. It comprises of software techniques to create, store, modify, represents pictures.
Why computer graphics used?
Suppose a shoe manufacturing company want to show the sale of shoes for five years. For this vast amount of information is to store. So a lot of time and memory will be needed. This method will be tough to understand by a common man. In this situation graphics is a better alternative. Graphics tools are charts and graphs. Using graphs, data can be represented in pictorial form. A picture can be understood easily just with a single look. Interactive computer graphics work using the concept of two-way communication between computer users. The computer will receive signals from the input device, and the picture is modified accordingly. Picture will be changed quickly when we apply command.
Types of Computer Graphics
Raster Graphics: In raster graphics pixels are used for an image to be drawn. It is also known as a bitmap image in which a sequence of image is into smaller pixels. Basically a bitmap indicates a large number of pixels together.
Vector Graphics: In vector graphics, mathematical formulae are used to draw different types of shapes, lines, objects and so on.
Computer Graphics Applications:
- Computer Art: MS Paint.
- Presentation Graphics : It is used to summarize financial statistical scientific or economic data. For example- Bar chart, Line chart.
- Entertainment: It is used in motion picture, music video, television gaming.
- Education and training: It is used to understand operations of complex system. It is also used for specialized system such for framing for captains, pilots and so on.
- Visualization: To study trends and patterns. For example: Analyzing satellite photo of earth.
- Computer graphics user interfaces GUIs :A graphic, mouse-oriented paradigm which allows the user to interact with a computer. For engineering and architectural system, these are used in electrical automobile, electro-mechanical, mechanical, electronic devices. For example: gears and bolts.
- Business presentation graphics :A picture is worth a thousand words”.
- Cartography: Drawing maps.
- Weather Maps :Real-time mapping, symbolic representations.
- Satellite Imaging: Geodesic images.
- Photo Enhancement: Sharpening blurred photos.
- Medical imaging :MRIs, CAT scans, etc. – Non-invasive internal examination.
- Engineering drawings: mechanical, electrical, civil, etc. – Replacing the blueprints of the past.
- Typography: The use of character images in publishing – replacing the hard type of the past.
- Architecture :Construction plans, exterior sketches – replacing the blueprints and hand drawings of the past.
- Art: Computers provide a new medium for artists.
- Training: Flight simulators, computer aided instruction, etc.
- Simulation and modeling: Replacing physical modeling and enactments
Cathode Ray Tube
The video monitor is primary output device in a graphical system. The main element of a video monitor is the Cathode Ray Tube CRTCRT, shown in the following illustration.
The operation of CRT is very simple:
- The electron gun emits a beam of electrons cathode rays.
- The electron beam passes through focusing and deflection systems that direct it towards specified positions on the phosphor coated screen.
- When the beam hits the screen, the phosphor emits a small spot of light at each position contacted by the electron beam.
- It redraws the picture by directing the electron beam back over the same screen points quickly.
There are two ways Random scan and Raster scan by which we can display an object on the screen.
Raster Scan
In a raster scan system, the electron beam is swept across the screen, one row at a time from top to bottom. As the electron beam moves across each row, the beam intensity is turned on and off to create a
 pattern of illuminated spots.
Picture definition is stored in memory area called the Refresh Buffer or Frame Buffer. This memory area holds the set of intensity values for all the screen points. Stored intensity values are then retrieved from the refresh buffer and “painted” on the screen one row scanline at a time as shown in the following illustration. Each screen point is referred to as a pixel picture element or pel. At the end of each scan line, the electron beam returns to the left side of the screen to begin displaying the next scan line.
Random Scan Vector Scan
In this technique, the electron beam is directed only to the part of the screen where the picture is to be drawn rather than scanning from left to right and top to bottom as in raster scan. It is also called vector display, stroke-writing display, or calligraphic display. Picture definition is stored as a set of line-drawing commands in an area of memory referred to as the refresh display file. To display a specified picture, the system cycles through the set of commands in the display file, drawing each component line in turn. After all the line-drawing commands are processed, the system cycles back to the first line command in the list. Random-scan displays are designed to draw all the component lines of a picture 30 to 60 times each second.
Scan Conversion
Scan Conversion is a process of representing graphics objects a collection of pixels. The graphics objects are continuous. The pixels used are discrete. Each pixel can have either on or off state. The circuitry of the video display device of the computer is capable of converting binary values (0, 1) into a pixel on and pixel off information. 0 is represented by pixel off. 1 is represented using pixel on. Using this ability graphics computer represent picture having discrete dots. Any model of graphics can be reproduced with a dense matrix of dots or points. Most human beings think graphics objects as points, lines, circles, ellipses. For generating graphical object, many algorithms have been developed. Examples of objects which can be scan
- converted
- Point
- Line
- Sector
- Arc
- Ellipse
- Rectangle
- Polygon
- Characters
- Filled Regions
The process of converting is also called as rasterization. The algorithms implementation varies from one computer system to another computer system. Some algorithms are implemented using the software, hardware or firmware.
Pixel or Pel:
pixel is a short form of the picture element. that is also called a point or dot. It is the smallest picture unit accepted by display devices. A picture is constructed from hundreds of such pixels. Pixels are generated using commands. Lines, circle, arcs, characters; curves are drawn with closely spaced pixels. In order to display the digit or letter matrix of pixels is used.

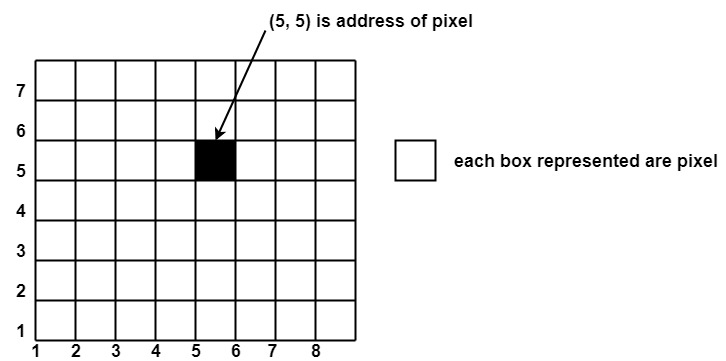
The coordinate is represented using row and column. P (5, 5) used to represent a pixel in the 5th row and the 5th column. Each pixel has some intensity value which is represented in memory of computer called a frame buffer. Frame Buffer is also called a refresh buffer.
Scan Converting a Point
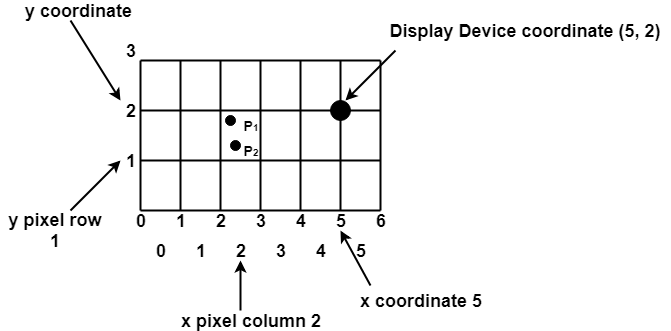
Each pixel on the graphics display does not represent a mathematical point. Rather, it means a region which theoretically can contain an infinite number of points. Scan-Converting a point involves illuminating the pixel that contains the point.
Example: Display coordinates points  as shown in fig would both be represented by pixel (2, 1). In general, a point p (x, y) is represented by the integer part of x & the integer part of y that is pixels [(INT (x), INT (y).


0 Comments