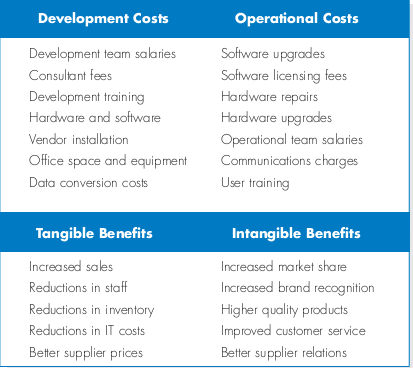
Software project management is an essential part of software engineering. Projects need to be managed because professional software engineering is always subject to organizational budget and schedule constraints. The project manager‘s job is to ensure that the software project meets and overcomes these constraints as well as delivering high-quality software. Good management cannot guarantee project success. However, bad management usually results in project failure: the software may be delivered late, cost more than originally estimated, or fail to meet the expectations of customers.
The success criteria for project management obviously vary from project to project but, for most projects, important goals are:
Deliver the software to the customer at the agreed time.
Keep overall costs within budget.
Deliver software that meets the customer‘s expectations.
Maintain a happy and well-functioning development team.
These goals are not unique to software engineering but are the goals of all engineering projects. However, software engineering is different from other types of engineering in a number of ways that make software management particularly challenging.
Some of these differences are:
The product is intangible A manager of a shipbuilding or a civil engineering project can see the product being developed. If a schedule slips, the effect on the product is visible—parts of the structure are obviously unfinished.Software is intangible. It cannot be seen or touched. Software project managers cannot see progress by simply looking at the artifact that is being constructed. Rather, they rely on others to produce evidence that they can use to review the progress of the work.
Large software projects are often ‗one-off ‘ projects Large software projects are usually different in some ways from previous projects. Therefore, even managers who have a large body of previous experience may find it difficult to anticipate problems. Furthermore, rapid technological changes in computers and communications can make a manager‘s experience obsolete. Lessons learned from previous projects may not be transferable to new projects.
Software processes are variable and organization-specific The engineering process for some types of system, such as bridges and buildings, is well understood. However, software processes vary quite significantly from one organization to another. Although there has been significant progress in process standardization and improvement, we still cannot reliably predict when a particular software process is likely to lead todevelopment problems. This is especially true when the software project is part of a wider systems engineering project.
It is impossible to write a standard job description for a software project manager. The job varies tremendously depending on the organization and the software product being developed. However, most managers take responsibility at some stage for some or all of the following activities:
Project planning Project managers are responsible for planning, estimating and scheduling project development, and assigning people to tasks. They supervise the work to ensure that it is carried out to the required standards and monitor progress to check that the development is on time and within budget.
Reporting Project managers are usually responsible for reporting on the progress of a project to customers and to the managers of the company developing the software. They have to be able to communicate at a range of levels, from detailed technical information to management summaries. They have to write concise, coherent documents that abstract critical information from detailed project reports. They must be able to present this information during progress reviews.
Risk management Project managers have to assess the risks that may affect a project, monitor these risks, and take action when problems arise.
People management Project managers are responsible for managing a team of people. They have to choose people for their team and establish ways of working that lead to effective team performance.
Proposal writing The first stage in a software project may involve writing a proposal to win a contract to carry out an item of work. The proposal describes the objectives of the project and how it will be carried out. It usually includes cost and schedule estimates and justifies why the project contract should be awarded to a particular organization or team. Proposal writing is a critical task as the survival of many software companies depends on having enough proposals accepted and contracts awarded. There can be no set guidelines for this task; proposal writing is a skill that you acquire through practice and experience.
Risk management
Risk management is one of the most important jobs for a project manager. Risk management involves anticipating risks that might affect the project schedule or the quality of the software being developed, and then taking action to avoid these risks (Hall,
1998; Ould, 1999). You can think of a risk as something that you‘d prefer not to have happen. Risks may threaten the project, the software that is being developed, or the organization. There are, therefore, three related categories of risk:
Project risks Risks that affect the project schedule or resources. An example of a project risk is the loss of an experienced designer. Finding a replacement designer with appropriate skills and experience may take a long time and, consequently, the software design will take longer to complete.
Product risks Risks that affect the quality or performance of the software being developed. An example of a product risk is the failure of a purchased component to perform as expected. This may affect the overall performance of the system so that it is slower than expected.
Business risks Risks that affect the organization developing or procuring the software. For example, a competitor introducing a new product is a business risk. The introduction of a competitive product may mean that the assumptions made about sales of existing software products may be unduly optimistic.
Risk
Affects
Description
Staff turnover
Project
Experienced staff will leave the project before it is finished.
Management change
Project
There will be a change of organizational management with different priorities.
Hardware unavailability
Project
Hardware that is essential for the project will not be delivered on schedule.
Requirements change
Project and product
There will be a larger number of changes to the requirements than anticipated.
Specification delays
Project and product
Specifications of essential interfaces are not available on schedule.
Size underestimate
Project and product
The size of the system has been underestimated.
CASE tool under performance
Product
CASE tools, which support the project, do not perform as anticipated.
Technology change
Product
Business The underlying technology on which the system is built is superseded by new technology.
Product competition
Business
A competitive product is marketed before the system is completed.
Figure 22.1 Examples of common project, product, and business risks
An outline of the process of risk management is illustrated in Figure 22.2. It involves several stages:
Risk identification You should identify possible project, product, and business risks.
Risk analysis You should assess the likelihood and consequences of these risks.
Risk planning You should make plans to address the risk, either by avoiding it or minimizing its effects on the project.
Risk monitoring You should regularly assess the risk and your plans for risk mitigation and revise these when you learn more about the risk.
You should document the outcomes of the risk management process in a risk management plan. This should include a discussion of the risks faced by the project, an analysis of these risks, and information on how you propose to manage the risk if it seems likely to be a problem. The risk management process is an iterative process that continues throughout the project. Once you have drawn up an initial risk management plan, you monitor the situation to detect emerging risks.
Figure 22.2 The risk management process
Software pricing
In principle, the price of a software product to a customer is simply the cost of development plus profit for the developer. In practice, however, the relationship between the project cost and the price quoted to the customer is not usually so simple. When calculating a price, you should take broader organizational, economic, political, and business considerations into account, such as those shown in Figure 23.1.
Figure 23.1 Factors affecting software pricing
Project plans
In a plan-driven development project, a project plan sets out the resources available to the project, the work breakdown, and a schedule for carrying out the work. The plan should identify risks to the project and the software under development, and the approach that is taken to risk management. Although the specific details of project plans vary depending on the type of project and organization, plans normally include the following sections:
Introduction This briefly describes the objectives of the project and sets out the constraints (e.g., budget, time, etc.) that affect the management of the project.
Project organization This describes the way in which the development team is organized, the people involved, and their roles in the team.
Risk analysis This describes possible project risks, the likelihood of these risks arising, and the risk reduction strategies that are proposed.
Hardware and software resource requirements This specifies the hardware and support software required to carry out the development. If hardware has to be bought, estimates of the prices and the delivery schedule may be included.
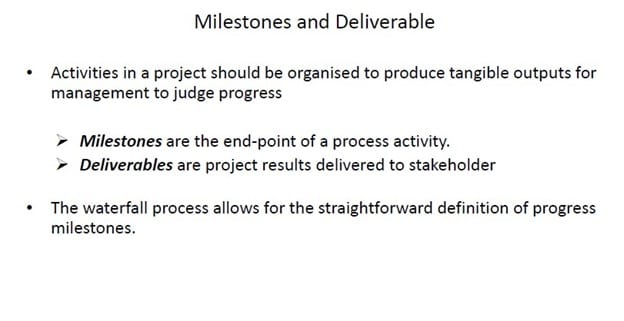
Work breakdown This sets out the breakdown of the project into activities and identifies the milestones and deliverables associated with each activity. Milestones are key stages in the project where progress can be assessed; deliverables are work products that are delivered to the customer.
Project schedule This shows the dependencies between activities, the estimated time required to reach each milestone, and the allocation of people to activities.
Monitoring and reporting mechanisms This defines the management reports that should be produced, when these should be produced, and the project monitoring mechanisms to be used.
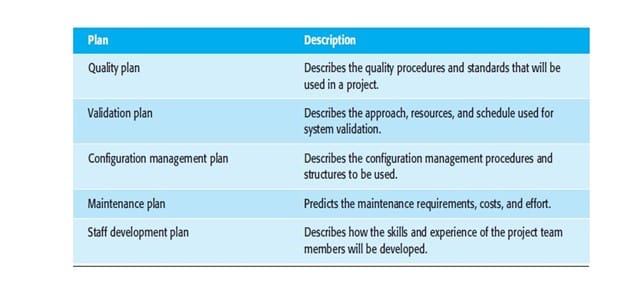
As well as the principal project plan, which should focus on the risks to the projects and the project schedule, you may develop a number of supplementary plans to support other process activities such as testing and configuration management. Examples of possible supplementary plans are shown in Figure 23.2.
Figure 23.2 Project plan supplements
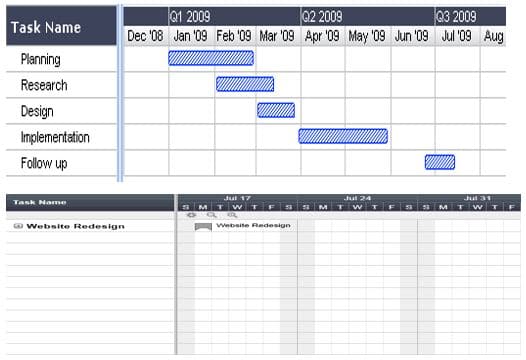
Project scheduling
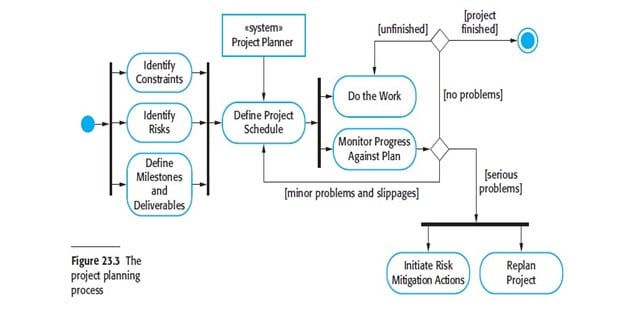
Project scheduling is the process of deciding how the work in a project will be organized as separate tasks, and when and how these tasks will be executed. You estimate the calendar time needed to complete each task, the effort required, and who will work on the tasks that have been identified. You also have to estimate the resources needed to complete each task, such as the disk space required on a server, the time required on specialized hardware, such as a simulator, and what the travel budget will be. In terms of the planning stages that I discussed in the introduction of this chapter, an initial project schedule is usually created during the project startup phase. This schedule is then refined and modified during development planning.
Schedule representation
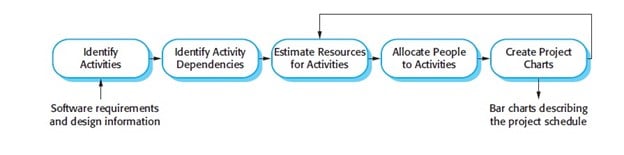
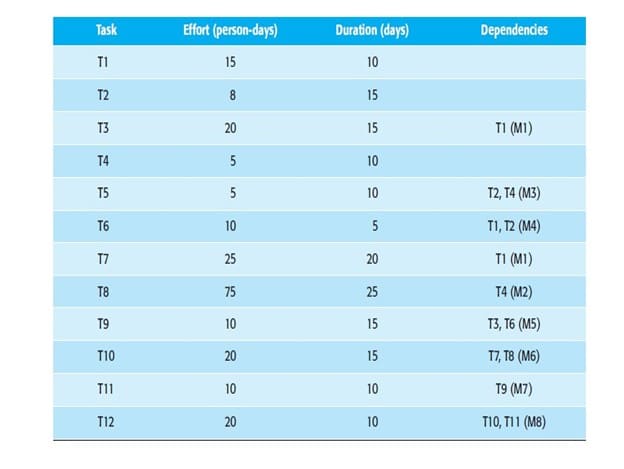
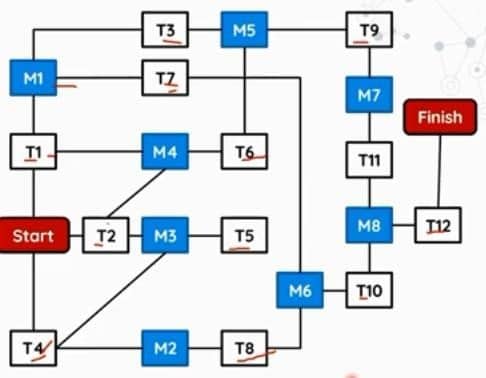
Project schedules may simply be represented in a table or spreadsheet showing the tasks, effort, expected duration, and task dependencies (Figure 23.5). However, this style of representation makes it difficult to see the relationships and dependencies between the different activities. For this reason, alternative graphical representations of project schedules have been developed that are often easier to read and understand.
Figure 23.4 The project scheduling process
There are two types of representation that are commonly used:
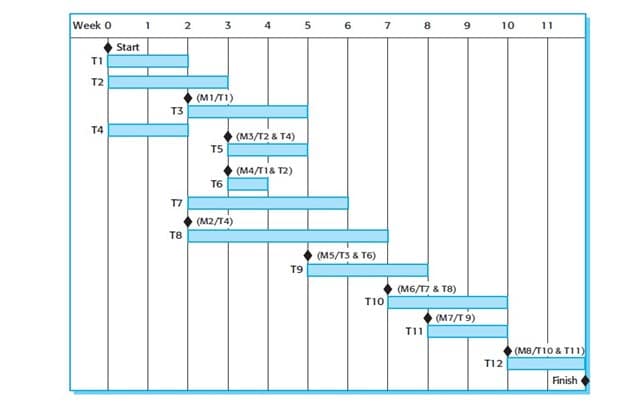
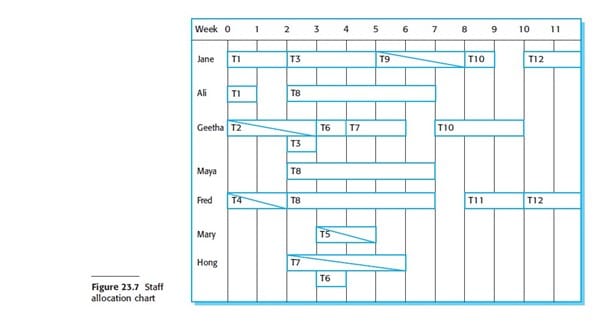
Bar charts, which are calendar-based, show who is responsible for each activity, the expected elapsed time, and when the activity is scheduled to begin and end. Bar charts are sometimes called ‗Gantt charts‘, after their inventor, Henry Gantt.
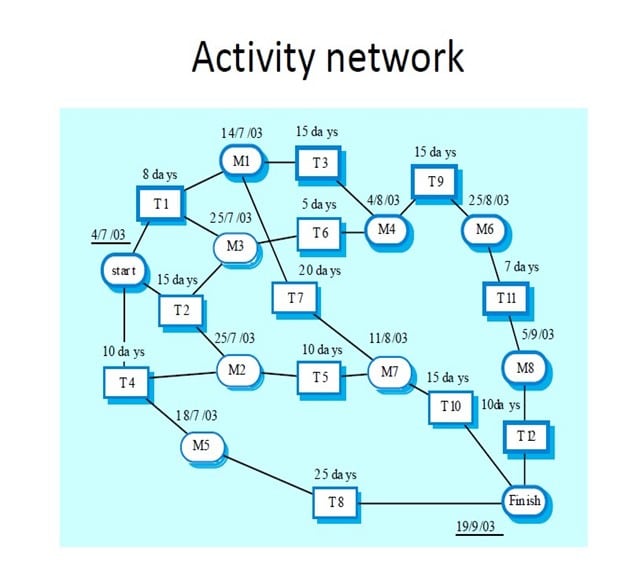
Activity networks, which are network diagrams, show the dependencies between the different activities making up a project. Normally, a project planning tool is used to manage project schedule information. These tools usually expect you to input project information into a table and will then create a database of project information. Bar charts and activity charts can then be generated automatically from this database.
Project activities are the basic planning element. Each activity has:
A duration in calendar days or months.
An effort estimate, which reflects the number of person-days or person-months to complete the work.
A deadline by which the activity should be completed.
A defined endpoint. This represents the tangible result of completing the activity. This could be a document, the holding of a review meeting, the successful execution of all tests, etc.
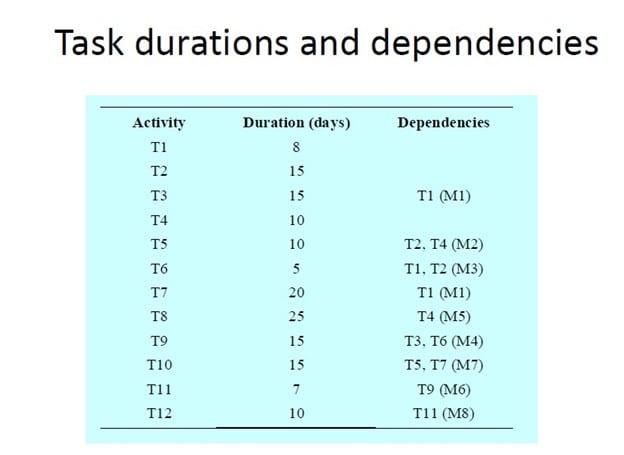
Figure 23.5 Tasks, durations, and dependencies
Figure 23.6 Activity bar chart
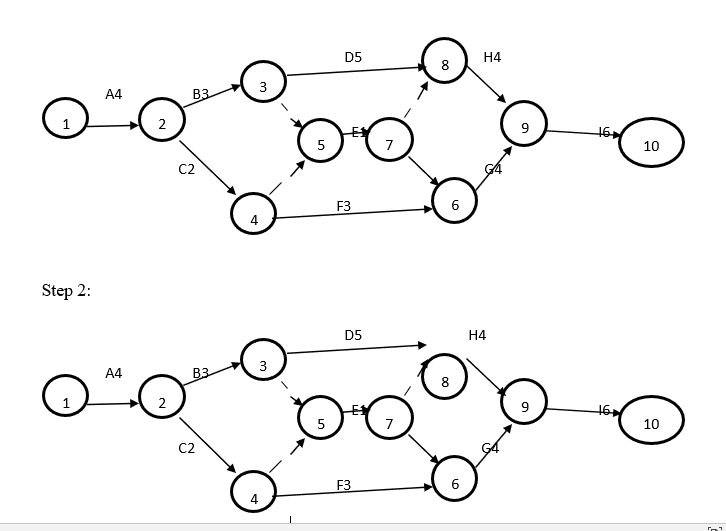
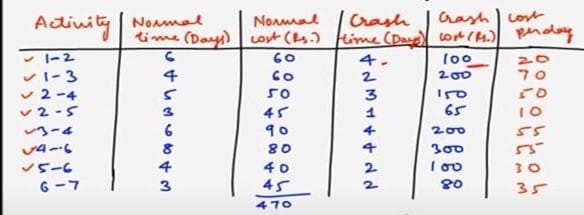
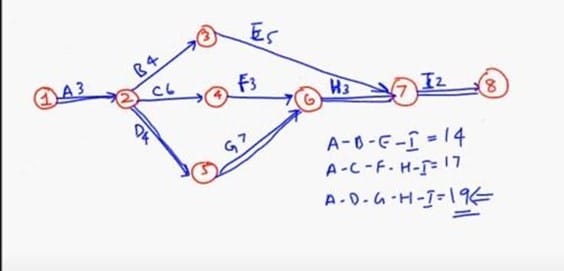
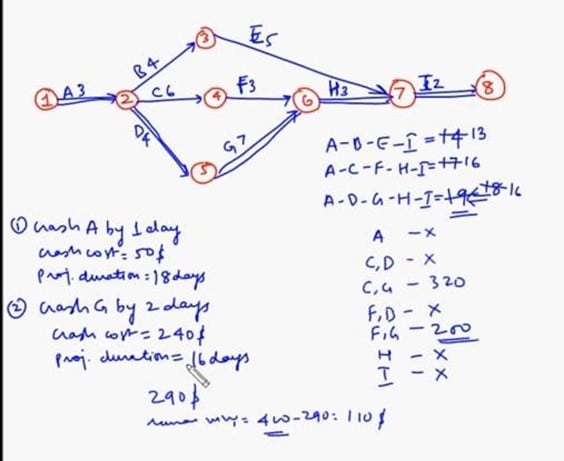
Problem 1:
Draw the Activity network diagram for the following task.
Find the critical path and estimated completion time.
To shorten the project three week which task will be shorten and what will be the estimated project cost?
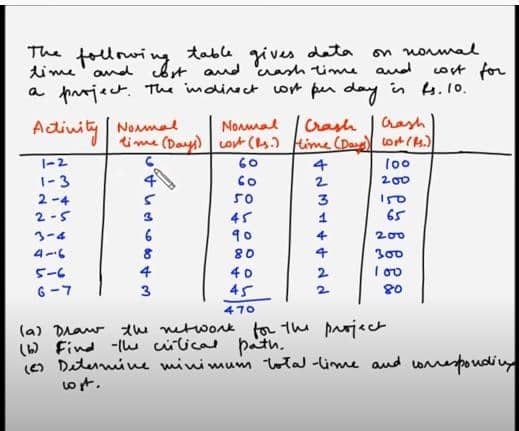
Activity
Preceding Activity
Normal Time
Crash Time
Normal Cost
Crash Cost
Weeks available for crashing
Cost for crashing per week
A
–
4
2
10,000
11,000
B
A
3
2
6,000
4,000
C
A
2
1
4,000
6,000
D
B
5
3
14,000
18,000
E
B,C
1
1
9,000
9,000
F
C
3
2
7,000
8,000
G
E,F
4
2
13,000
25,000
H
D,E
4
1
11,000
18,000
I
H,G
6
5
20,000
24,000
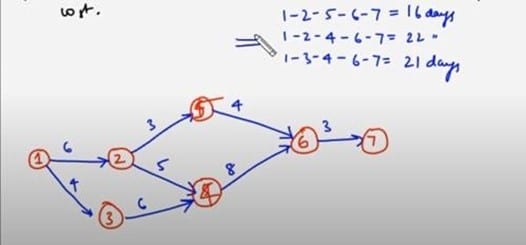
Step 1:
Step 1:
Activity
Preceding Activity
Normal Time
Crash Time
Normal Cost
Crash Cost
Weeks available for crashing
Cost for crashing per week
A
–
4
2
10,000
11,000
500
2
B
A
3
2
7,000
4,000
3,000
1
C
A
2
1
4,000
6,000
2,000
1
D
B
5
3
14,000
18,000
2,000
2
E
B,C
1
1
9,000
9,000
0
0
F
C
3
2
7,000
8,000
1,000
1
G
E,F
4
2
13,000
25,000
6,000
2
H
D,E
4
1
11,000
18,000
2,333
3
I
H,G
6
5
20,000
24,000
4,000
1
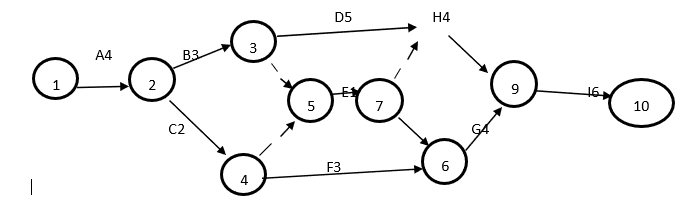
A – B – D – H – I = 22
A – B – E – H – I = 18
A – B – E – G – I = 18
A – C – E – H – I = 17
A – C – E – G – I = 17
A – C – F – G– I = 14
Here the critical path is , A – B – D – H – I = 22
Although there are many approaches to rapid software development, they share some fundamental characteristics:
The processes of specification, design, and implementation are interleaved. There is no detailed system specification, and design documentation is minimized or generated automatically by the programming environment used to implement the system. The user requirements document only defines the most important characteristics of the system.
The system is developed in a series of versions. End-users and other system stakeholders are involved in specifying and evaluating each version. They may propose changes to the software and new requirements that should be implemented in a later version of the system.
System user interfaces are often developed using an interactive development system that allows the interface design to be quickly created by drawing and placing icons on the interface. The system may then generate a web-based interface for a browser or an interface for a specific platform such as Microsoft Windows.
Agile methods are incremental development methods in which the increments are small and, typically, new releases of the system are created and made available to customers every two or three weeks. They involve customers in the development process to get rapid feedback on changing requirements. They minimize documentation by using informal communications rather than formal meetings with written documents.
Agile methods:
Agile methods have been very successful for some types of system development:
Product development where a software company is developing a small or medium-sized product for sale.
Custom system development within an organization, where there is a clear commitment from the customer to become involved in the development process and where there are not a lot of external rules and regulations that affect the software.
Principal
Description
Customer involvement
Customers should be closely involved throughout the development process. Their role is provide and prioritize new system requirements and to evaluate the iterations of the system.
Incremental delivery
The software is developed in increments with the customer specifying the requirements to be included in each increment.
People not process
The skills of the development team should be recognized and exploited. Team members should be left to develop their own ways of working without prescriptive processes.
Embrace change
Expect the system requirements to change and so design the system to accommodate these changes.
Maintain simplicity
Focus on simplicity in both the software being developed and in the development process. Wherever possible, actively work to eliminate complexity from the system.
The principles underlying agile methods are sometimes difficult to realize:
Although the idea of customer involvement in the development process is an attractive one, its success depends on having a customer who is willing and able to spend time with the development team and who can represent all system stakeholders. Frequently, the customer representatives are subject to other pressure and cannot take full part in the software development.
Individual team members may not have suitable personalities for the intense involvement that is typical of agile methods, and therefore not interact well with other team members.
Prioritizing changes can be extremely difficult, especially in systems for which there are many stakeholders. Typically, each stakeholder gives different priorities to different changes.
Maintaining simplicity requires extra work. Under pressure from delivery schedules, the team members may not have time to carry out desirable system simplifications.
Many organizations, especially large companies, have spent years changing their culture so that processes are defined and followed. It is difficult for them to move to a working model in which processes are informal and defined by development teams.
Another non-technical problem—that is a general problem with incremental development and delivery—occurs when the system customer uses an outside organization for system development. The software requirements document is usually part of the contract between the customer and the supplier. Because incremental specification is inherent in agile methods, writing contracts for this type of development may be difficult.
There are two questions that should be considered when considering agile methods and maintenance:
Are systems that are developed using an agile approach maintainable, given the emphasis in the development process of minimizing formal documentation?
Can agile methods be used effectively for evolving a system in response to customer change requests?
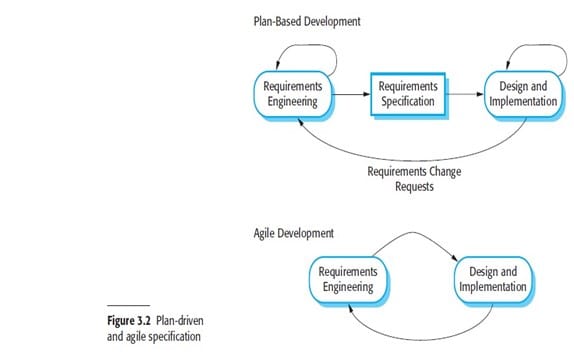
Plan-Driven and Agile Development
Agile approaches to software development consider design and implementation to be the central activities in the software process. They incorporate other activities, such as requirements elicitation and testing, into design and implementation. By contrast, a plan-driven approach to software engineering identifies separate stages in the software process with outputs associated with each stage. The outputs from
one stage are used as a basis for planning the following process activity. Figure 3.2 shows the distinctions between plan-driven and agile approaches to system specification.
In a plan-driven approach, iteration occurs within activities with formal documents used to communicate between stages of the process. For example, the requirements will evolve and, ultimately, a requirements specification will be produced. This is then an input to the design and implementation process. In an agile approach, iteration occurs across activities. Therefore, the requirements and the design are developed together, rather than separately.
A plan-driven software process can support incremental development and delivery. It is perfectly feasible to allocate requirements and plan the design and development phase as a series of increments. An agile process is not inevitably code-focused and it may produce some design documentation. As I discuss in the following section, the agile development team may decide to include a documentation ‗spike‘, where, instead of producing a new version of a system, the team produce system documentation.
In fact, most software projects include practices from plan-driven and agile approaches. To decide on the balance between a plan-based and an agile approach, you have to answer a range of technical, human, and organizational questions:
Is it important to have a very detailed specification and design before moving to implementation? If so, you probably need to use a plan-driven approach.
Is an incremental delivery strategy, where you deliver the software to customers and get rapid feedback from them, realistic? If so, consider using agile methods.
How large is the system that is being developed? Agile methods are most effective when the system can be developed with a small co-located team who can communicate informally. This may not be possible for large systems that require larger development teams so a plan-driven approach may have to be used.
What type of system is being developed? Systems that require a lot of analysis before implementation (e.g., real-time system with complex timing requirements) usually need a fairly detailed design to carry out this analysis. A plan-driven approach may be best in those circumstances.
What is the expected system lifetime? Long-lifetime systems may require more design documentation to communicate the original intentions of the system developers to the support team. However, supporters of agile methods rightly argue that documentation is frequently not kept up to date and it is not of much use for long-term system maintenance.
What technologies are available to support system development? Agile methods often rely on good tools to keep track of an evolving design. If you are developing a system using an IDE that does not have good tools for program visualization and analysis, then more design documentation may be required.
How is the development team organized? If the development team is distributed or if part of the development is being outsourced, then you may need to develop design documents to communicate across the development teams. You may need to plan in advance what these are.
Are there cultural issues that may affect the system development? Traditional engineering organizations have a culture of plan-based development, as this is the norm in engineering. This usually requires extensive design documentation, rather than the informal knowledge used in agile processes.
How good are the designers and programmers in the development team? It is sometimes argued that agile methods require higher skill levels than plan-based approaches in which programmers simply translate a detailed design into code. If you have a team with relatively low skill levels, you may need to use the best people to develop the design, with others responsible for programming.
Is the system subject to external regulation? If a system has to be approved by an external regulator (e.g., the Federal Aviation Authority [FAA] approve software that is critical to the operation of an aircraft) then you will probably be required to produce detailed documentation as part of the system safety case.
In reality, the issue of whether a project can be labeled as plan-driven or agile is not very important. Ultimately, the primary concern of buyers of a software system is whether or not they have an executable software system that meets their needs and does useful things for the individual user or the organization. In practice, many companies who claim to have used agile methods have adopted some agile practices and have integrated these with their plan-driven processes.
Extreme programming
Extreme programming (XP) is perhaps the best known and most widely used of the agile methods. The name was coined by Beck (2000) because the approach was developed by pushing recognized good practice, such as iterative development, to ‗extreme‘ levels. For example, in XP, several new versions of a system may be developed by different programmers, integrated and tested in a day.
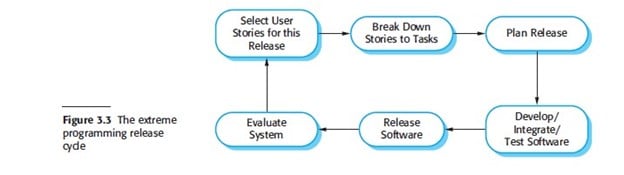
In extreme programming, requirements are expressed as scenarios (called user stories), which are implemented directly as a series of tasks. Programmers work in pairs and develop tests for each task before writing the code. All tests must be successfully executed when new code is integrated into the system. There is a short time gap between releases of the system. Figure 3.3 illustrates the XP process to produce an increment of the system that is being developed.
Extreme programming involves a number of practices, summarized in Figure 3.4, which reflect the principles of agile methods:
Incremental development is supported through small, frequent releases of the system. Requirements are based on simple customer stories or scenarios that are used as a basis for deciding what functionality should be included in a system increment.
Customer involvement is supported through the continuous engagement of the customer in the development team. The customer representative takes part in the development and is responsible for defining acceptance tests for the system.
People, not process, are supported through pair programming, collective ownership of the system code, and a sustainable development process that does not involve excessively long working hours.
Change is embraced through regular system releases to customers, test-first development, refactoring to avoid code degeneration, and continuous integration of new functionality.
Maintaining simplicity is supported by constant refactoring that improves code quality and by using simple designs that do not unnecessarily anticipate future changes to the system.
Principal of Practice
Description
Incremental planning
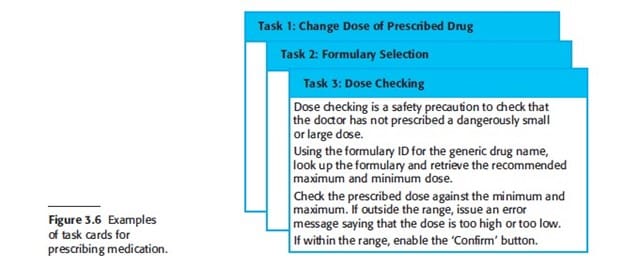
Requirements are recorded on Story Cards and the Stories to be included in a release are determined by the time available and their relative priority. The developers break these Stories into development ‗Tasks‘. See Figures 3.5 and 3.6.
Small releases
The minimal useful set of functionality that provides business value is developed first. Releases of the system are frequent and incrementally add functionality to the first release.
Simple design
Enough design is carried out to meet the current requirements and no more. An automated unit test framework is used to write tests for a new
Test-first development
piece of functionality before that functionality itself is implemented.
Refactoring
All developers are expected to refactor the code continuously as soon as possible code improvements are found. This keeps the code simple and maintainable.
Pair programming
Developers work in pairs, checking each other‘s work and providing the support to always do a good job.
Collective ownership
The pairs of developers work on all areas of the system, so that no islands of expertise develop and all the developers take responsibility for all of the code. Anyone can change anything.
Continuous integration
As soon as the work on a task is complete, it is integrated into the whole system. After any
such integration, all the unit tests in the system must pass.
Sustainable pace
Large amounts of overtime are not considered acceptable as the net effect is often to reduce code quality and medium term productivity.
On-site customer
A representative of the end-user of the system (the Customer) should be available full time for the use of the XP team. In an extreme programming process, the customer is a member of the development team and is responsible for bringing system requirements to the team for implementation.
Figure 3.4 Extreme programming practices
In an XP process, customers are intimately involved in specifying and prioritizing system requirements. The requirements are not specified as lists of required system functions. Rather, the system customer is part of the development team and discusses scenarios with other team members. Together, they develop a ‗story card‘ that encapsulates the customer needs. The development team then aims to implement that scenario in a future release of the software. An example of a story card for the mental health care patient management system is shown in Figure 3.5. This is a short description of a scenario for prescribing medication for a patient. The story cards are the main inputs to the XP planning process or the ‗planning game‘. Once the story cards have been developed, the development team breaks these down into tasks (Figure 3.6) and estimates the effort and resources required for implementing each task. This usually involves discussions with the customer to refine the requirements. The customer then prioritizes the stories for implementation, choosing those stories that can be used immediately to deliver useful business support. The intention is to identify useful functionality that can be implemented in about two weeks, when the next release of the system is made available to the customer. Of course, as requirements change, the unimplemented stories change or may be discarded. If changes are required for a system that has already been delivered, new story cards are developed and again, the customer decides whether these changes should have priority over new functionality.
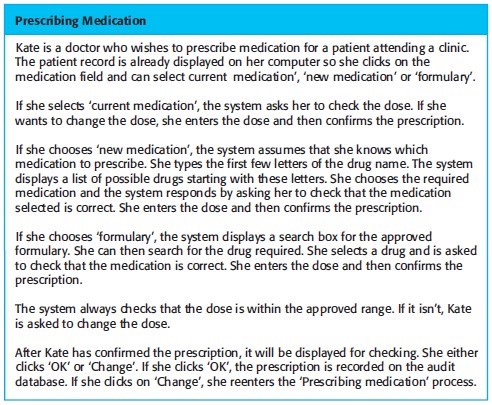
Figure 3.5 A ‗prescribing medication‘ story.
Sometimes, during the planning game, questions that cannot be easily answered come to light and additional work is required to explore possible solutions. The team may carry out some prototyping or trial development to understand the problem and solution. In XP terms, this is a ‗spike‘, an increment where no programming is done. There may also be ‗spikes‘ to design the system architecture or to develop system documentation. Extreme programming takes an ‗extreme‘ approach to incremental development. New versions of the software may be built several times per day and releases are delivered to customers roughly every two weeks. Release deadlines are never slipped; if there are development problems, the customer is consulted and functionality is removed from the planned release. When a programmer builds the system to create a new version, he or she must run all existing automated tests as well as the tests for the new functionality. The new build of the software is accepted only if all tests execute successfully. This then becomes the basis for the next iteration of the system. A fundamental precept of traditional software engineering is that you should design for change. That is, you should anticipate future changes to the software and design it so that these changes can be easily implemented. Extreme programming, however, has discarded this principle on the basis that designing for change is often wasted effort. It isn‘t worth taking time to add generality to a program to cope with change. The changes anticipated often never materialize and completely different change requests may actually be made. Therefore, the XP approach accepts that changes will happen and reorganize the software when these changes actually occur.
A general problem with incremental development is that it tends to degrade the software structure, so changes to the software become harder and harder to implement. Essentially, the development proceeds by finding workarounds to problems, with the result that code is often duplicated, parts of the software are reused in inappropriate ways, and the overall structure degrades as code is added to the system. Extreme programming tackles this problem by suggesting that the software should be constantly refactored. This means that the programming team look for possible improvements to the software and implement them immediately. When a team member sees code that can be improved, they make these improvements even in situations where there is no immediate need for them. Examples of refactoring include the reorganization of a class hierarchy to remove duplicate code, the tidying up and renaming of attributes and methods, and the replacement of code with calls to methods defined in a program library. Program development environments, such as Eclipse (Carlson, 2005), include tools for refactoring which simplify the process of finding dependencies between code sections and making global code modifications.
In principle then, the software should always be easy to understand and change as new stories are implemented. In practice, this is not always the case. Sometimes development pressure means that refactoring is delayed because the time is devoted to the implementation of new functionality. Some new features and changes cannot readily be accommodated by code-level refactoring and require the architecture of the system to be modified. In practice, many companies that have adopted XP do not use all of the extreme programming practices listed in Figure 3.4. They pick and choose according to their local ways of working. For example, some companies find pair programming helpful; others prefer to use individual programming and reviews. To accommodate different levels of skill, some programmers don‘t do refactoring in parts of the system they did not develop, and conventional requirements may be used rather than user stories. However, most companies who have adopted an XP variant use small releases, test-first development, and continuous integration.
Agile project management
The principal responsibility of software project managers is to manage the project so that the software is delivered on time and within the planned budget for the project. They supervise the work of software engineers and monitor how well the software development is progressing.
The standard approach to project management is plan-driven. A plan-based approach really requires a manager to have a stable view of everything that has to be developed and the development processes. However, it does not work well with agile methods where the requirements are developed incrementally; where the software is delivered in short, rapid increments; and where changes to the requirements and the software are the norm. Like every other professional software development process, agile development has to be managed so that the best use is made of the time and resources available to the team. This requires a different approach to project management, which is adapted to incremental development and the particular strengths of agile methods.
Scrum approach
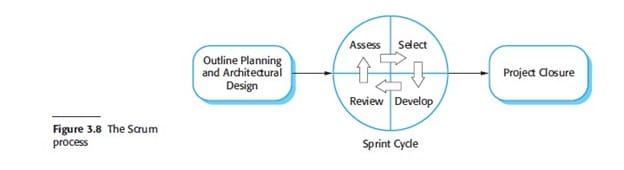
The Scrum approach (Schwaber, 2004; Schwaber and Beedle, 2001) is a general agile method but its focus is on managing iterative development rather than specific technical approaches to agile software engineering. Figure 3.8 is a diagram of the Scrum management process. Scrum does not prescribe the use of programming practices such as pair programming and test-first development. It can therefore be used with more technical agile approaches, such as XP, to provide a management framework for the project.
There are three phases in Scrum. The first is an outline planning phase where you establish the general objectives for the project and design the software architecture.
This is followed by a series of sprint cycles, where each cycle develops an increment of the system. Finally, the project closure phase wraps up the project, completes required documentation such as system help frames and user manuals, and assesses the lessons learned from the project.
The innovative feature of Scrum is its central phase, namely the sprint cycles. A Scrum sprint is a planning unit in which the work to be done is assessed, features are selected for development, and the software is implemented. At the end of a sprint, the completed functionality is delivered to stakeholders. Key characteristics of this process are as follows:
Sprints are fixed length, normally 2–4 weeks. They correspond to the development of a release of the system in XP.
The starting point for planning is the product backlog, which is the list of work to be done on the project. During the assessment phase of the sprint, this is reviewed, and priorities and risks are assigned. The customer is closely involved in this process and can introduce new requirements or tasks at the beginning of each sprint.
The selection phase involves all of the project team who work with the customer to select the features and functionality to be developed during the sprint.
Once these are agreed, the team organizes themselves to develop the software. Short daily meetings involving all team members are held to review progress and if necessary, reprioritize work. During this stage the team is isolated from the customer and the organization, with all communications channelled through the so-called ‗Scrum master‘. The role of the Scrum master is to protect the development team from external distractions. The way in which the work is done depends on the problem and the team. Unlike XP, Scrum does not make specific suggestions on how to write requirements, test-first development, etc. However, these XP practices can be used if the team thinks they are appropriate.
At the end of the sprint, the work done is reviewed and presented to stakeholders. The next sprint cycle then begins. The idea behind Scrum is that the whole team should be empowered to make decisions so the term ‗project manager‘, has been deliberately avoided. Rather, the ‗Scrum master‘ is a facilitator who arranges daily meetings, tracks the backlog of work to be done, records decisions, measures progress against the backlog, and communicates with customers and management outside of the team. The whole team attends the daily meetings, which are sometimes ‗stand-up‘ meetings to keep them short and focused. During the meeting, all team members share information, describe their progress since the last meeting, problems that have arisen, and what is planned for the following day. This means that everyone on the team knows what is going on and, if problems arise, can replan short-term work to cope with them. Everyone participates in this short-term planning—there is no top down direction from the Scrum master.
There are many anecdotal reports of the successful use of Scrum available on the Web. Rising and Janoff (2000) discuss its successful use in a telecommunication software development environment, and they list its advantages as follows:
The product is broken down into a set of manageable and understandable chunks.
Unstable requirements do not hold up progress.
The whole team has visibility of everything and consequently team communication is improved.
Customers see on-time delivery of increments and gain feedback on how the product works.
Trust between customers and developers is established and a positive culture is created in which everyone expects the project to succeed.
Scrum, as originally designed, was intended for use with co-located teams where all team members could get together every day in stand-up meetings. However, much software development now involves distributed teams with team members located in different places around the world. Consequently, there are various experiments going on to develop Scrum for distributed development environments (Smitsand Pshigoda, 2007; Sutherland et al., 2007).
understand the concepts of software processes and software process models;
have been introduced to three generic software process models and when they might be used;
know about the fundamental process activities of software requirements engineering, software development, testing, and evolution;
understand why processes should be organized to cope with changes in the software requirements and design;
understand how the Rational Unified Process integrates good software engineering practice to create adaptable software processes.
Software processes
A software process is a set of related activities that leads to the production of a software product. These activities may involve the development of software from scratch in a standard programming language like Java or C. However, business applications are not necessarily developed in this way. New business software is now often developed by extending and modifying existing systems or by configuring and integrating off-the-shelf software or system components. There are many different software processes but all must include four activities that are fundamental to software engineering:
Software specification The functionality of the software and constraints on its operation must be defined.
Software design and implementation The software to meet the specification must be produced.
Software validation The software must be validated to ensure that it does what the customer wants.
Software evolution The software must evolve to meet changing customer needs.
In some form, these activities are part of all software processes. In practice, of course, they are complex activities in themselves and include sub-activities such as requirements validation, architectural design, unit testing, etc. There are also supporting process activities such as documentation and software configuration management. When we describe and discuss processes, we usually talk about the activities in these processes such as specifying a data model, designing a user interface, etc., and the ordering of these activities. However, as well as activities, process descriptions may also include:
Products, which are the outcomes of a process activity. For example, the outcome of the activity of architectural design may be a model of the software architecture.
Roles, which reflect the responsibilities of the people involved in the process. Examples of roles are project manager, configuration manager, programmer, etc.
Pre- and post-conditions, which are statements that are true before and after a process activity has been enacted or a product produced. For example, before architectural design begins, a precondition may be that all requirements have been approved by the customer; after this activity is finished, a post-condition might be that the UML models describing the architecture have been reviewed
software processes are categorized as either plan-driven or agile processes. Plan-driven processes are processes where all of the process activities are planned in advance and progress is measured against this plan. In agile processes, planning is incremental and it is easier to change the process to reflect changing customer requirements. As Boehm and Turner (2003) discuss, each approach is suitable for different types of software. Generally, you need to find a balance between plandriven and agile processes.
Software process models
A software process model is a simplified representation of a software process. Each process model represents a process from a particular perspective, and thus provides only partial information about that process. For example, a process activity model shows the activities and their sequence but may not show the roles of the people involved in these activities. In this section, I introduce a number of very general process models (sometimes called ‗process paradigms‘) and present these from an architectural perspective. That is, we see the framework of the process but not the details of specific activities. These generic models are not definitive descriptions of software processes. Rather, they are abstractions of the process that can be used to explain different approaches to software development. You can think of them as process frameworks that may be extended and adapted to create more specific software engineering processes.
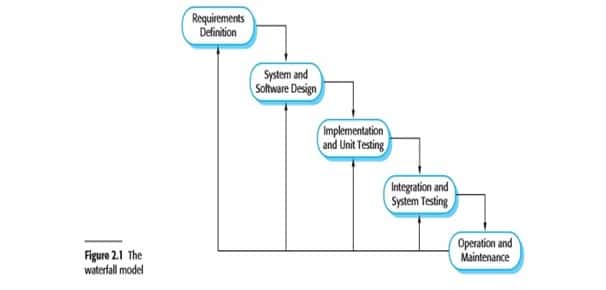
The waterfall model This takes the fundamental process activities of specification, development, validation, and evolution and represents them as separate process phases such as requirements specification, software design, implementation, testing, and so on.
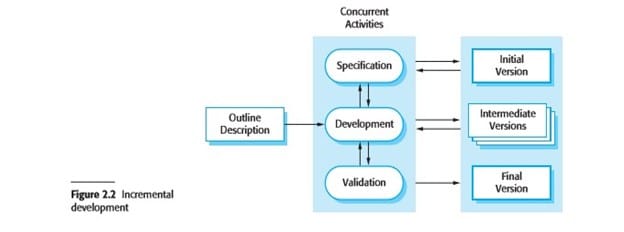
Incremental development This approach interleaves the activities of specification, development, and validation. The system is developed as a series of versions (increments), with each version adding functionality to the previous version.
Reuse-oriented software engineering This approach is based on the existence of a significant number of reusable components. The system development process focuses on integrating these components into a system rather than developing them from scratch.
These models are not mutually exclusive and are often used together, especially for large systems development. For large systems, it makes sense to combine some of the best features of the waterfall and the incremental development models. You need to have information about the essential system requirements to design a software architecture to support these requirements. You cannot develop this incrementally. Sub-systems within a larger system may be developed using different approaches. Parts of the system that are well understood can be specified and developed using a waterfall-based process. Parts of the system which are difficult to specify in advance, such as the user interface, should always be developed using an incremental approach.
The waterfall model
The first published model of the software development process was derived from more general system engineering processes (Royce, 1970). This model is illustrated in Figure 2.1. Because of the cascade from one phase to another, this model is known as the ‗waterfall model‘ or software life cycle. The waterfall model is an example of a plan-driven process—in principle, you must plan and schedule all of the process activities before starting work on them.
The principal stages of the waterfall model directly reflect the fundamental development activities:
Requirements analysis and definition The system‘s services, constraints, and goals are established by consultation with system users. They are then defined in detail and serve as a system specification.
System and software design The systems design process allocates the requirements to either hardware or software systems by establishing an overall system architecture. Software design involves identifying and describing the fundamental software system abstractions and their relationships.
Implementation and unit testing During this stage, the software design is realized as a set of programs or program units. Unit testing involves verifying that each unit meets its specification.
Integration and system testing The individual program units or programs are integrated and tested as a complete system to ensure that the software requirements have been met. After testing, the software system is delivered to the customer.
Operation and maintenance Normally (although not necessarily), this is the longest life cycle phase. The system is installed and put into practical use. Maintenance involves correcting errors which were not discovered in earlier stages of the life cycle, improving the implementation of system units and enhancing the system‘s services as new requirements are discovered.
In principle, the result of each phase is one or more documents that are approved (‗signed off‘). The following phase should not start until the previous phase has finished. In practice, these stages overlap and feed information to each other. During design, problems with requirements are identified. During coding, design problems are found and so on. The software process is not a simple linear model but involves feedback from one phase to another. Documents produced in each phase may then have to be modified to reflect the changes made.
Because of the costs of producing and approving documents, iterations can be costly and involve significant rework. Therefore, after a small number of iterations, it is normal to freeze parts of the development, such as the specification, and to continue with the later development stages. Problems are left for later resolution, ignored, or programmed around. This premature freezing of requirements may mean that the system won‘t do what the user wants. It may also lead to badly structured systems as design problems are circumvented by implementation tricks.
During the final life cycle phase (operation and maintenance) the software is put into use. Errors and omissions in the original software requirements are discovered. Program and design errors emerge and the need for new functionality is identified. The system must therefore evolve to remain useful. Making these changes (software maintenance) may involve repeating previous process stages.
The waterfall model is consistent with other engineering process models and documentation is produced at each phase. This makes the process visible so managers can monitor progress against the development plan. Its major problem is the inflexible partitioning of the project into distinct stages. Commitments must be made at an early stage in the process, which makes it difficult to respond to changing customer requirements. In principle, the waterfall model should only be used when the requirements are well understood and unlikely to change radically during system development. However, the waterfall model reflects the type of process used in other engineering projects. As is easier to use a common management model for the whole project, software processes based on the waterfall model are still commonly used. An important variant of the waterfall model is formal system development, where a mathematical model of a system specification is created. This model is then refined, using mathematical transformations that preserve its consistency, into executable code. Based on the assumption that your mathematical transformations are correct, you can therefore make a strong argument that a program generated in this way is consistent with its specification. Formal development processes, such as that based on the B method (Schneider, 2001; Wordsworth, 1996) are particularly suited to the development of systems that have stringent safety, reliability, or security requirements. The formal approach simplifies the production of a safety or security case. This demonstrates to customers or regulators that the system actually meets its safety or security requirements. Processes based on formal transformations are generally only used in the development of safety-critical or security-critical systems. They require specialized expertise. For the majority of systems this process does not offer significant cost benefits over other approaches to system development.
Waterfall Model – Application
Every software developed is different and requires a suitable SDLC approach to be followed based on the internal and external factors. Some situations where the use of Waterfall model is most appropriate are −
Requirements are very well documented, clear and fixed.
Product definition is stable.
Technology is understood and is not dynamic.
There are no ambiguous requirements.
Ample resources with required expertise are available to support the product.
The project is short.
Waterfall Model – Advantages
The advantages of waterfall development are that it allows for departmentalization and control. A schedule can be set with deadlines for each stage of development and a product can proceed through the development process model phases one by one. Development moves from concept, through design, implementation, testing, installation, troubleshooting, and ends up at operation and maintenance. Each phase of development proceeds in strict order.Some of the major advantages of the Waterfall Model are as follows −
Simple and easy to understand and use
Easy to manage due to the rigidity of the model. Each phase has specific deliverables and a review process.
Phases are processed and completed one at a time.
Works well for smaller projects where requirements are very well understood.
Clearly defined stages.
Well understood milestones.
Easy to arrange tasks.
Process and results are well documented.
Waterfall Model – Disadvantages
The disadvantage of waterfall development is that it does not allow much reflection or revision. Once an application is in the testing stage, it is very difficult to go back and change something that was not well-documented or thought upon in the concept stage.
The major disadvantages of the Waterfall Model are as follows − No working software is produced until late during the life cycle.
High amounts of risk and uncertainty.
Not a good model for complex and object-oriented projects.
Poor model for long and ongoing projects.
Not suitable for the projects where requirements are at a moderate to high risk of changing. So, risk and uncertainty is high with this process model.
It is difficult to measure progress within stages.
Cannot accommodate changing requirements.
Adjusting scope during the life cycle can end a project.
Integration is done as a “big-bang. at the very end, which doesn’t allow identifying any technological or business bottleneck or challenges early.
Incremental development
Incremental development is based on the idea of developing an initial implementation, exposing this to user comment and evolving it through several versions until an adequate system has been developed (Figure 2.2). Specification, development, and validation activities are interleaved rather than separate, with rapid feedback across activities. Incremental software development, which is a fundamental part of agile approaches, is better than a waterfall approach for most business, ecommerce, and personal systems. Incremental development reflects the way that we solve problems. We rarely work out a complete problem solution in advance but move toward a solution in a series of steps, backtracking when we realize that we have made a mistake. By developing the software incrementally, it is cheaper and easier to make changes in the software as it is being developed. Each increment or version of the system incorporates some of the functionality that is needed by the customer. Generally, the early increments of the system include the most important or most urgently required functionality. This means that the customer can evaluate the system at a relatively early stage in the development to see if it delivers what is required. If not, then only the current increment has to be changed and, possibly, new functionality defined for later increments.
Incremental development has three important benefits, compared to the waterfall model:
The cost of accommodating changing customer requirements is reduced. The amount of analysis and documentation that has to be redone is much less than is required with the waterfall model.
It is easier to get customer feedback on the development work that has been done. Customers can comment on demonstrations of the software and see how much has been implemented. Customers find it difficult to judge progress from software design documents.
More rapid delivery and deployment of useful software to the customer is possible, even if all of the functionality has not been included. Customers are able to use and gain value from the software earlier than is possible with a waterfall process.
Incremental development in some form is now the most common approach for the development of application systems. This approach can be either plan-driven, agile, or, more usually, a mixture of these approaches. In a plan-driven approach, the system increments are identified in advance; if an agile approach is adopted, the early increments are identified but the development of later increments depends on progress and customer priorities.
From a management perspective, the incremental approach has two problems:
The process is not visible. Managers need regular deliverables to measure progress. If systems are developed quickly, it is not cost-effective to produce documents that reflect every version of the system.
System structure tends to degrade as new increments are added. Unless time and money is spent on refactoring to improve the software, regular change tends to corrupt its structure. Incorporating further software changes becomes increasingly difficult and costly.
The problems of incremental development become particularly acute for large, complex, longlifetime systems, where different teams develop different parts of the system. Large systems need a stable framework or architecture and the responsibilities of the different teams working on parts of the system need to be clearly defined with respect to that architecture. This has to be planned in advance rather than developed incrementally. You can develop a system incrementally and expose it to customers for comment, without actually delivering it and deploying it in the customer‘s environment. Incremental delivery and deployment means that the software is used in real, operational processes. This is not always possible as experimenting with new software can disrupt normal business processes.
When to use Incremental models?
Requirements of the system are clearly understood
When demand for an early release of a product arises
When software engineering team are not very well skilled or trained
When high-risk features and goals are involved
Such methodology is more in use for web application and product based companies.
Reuse-oriented software engineering
In the majority of software projects, there is some software reuse. This often happens informally when people working on the project know of designs or code that are similar to what is required. They look for these, modify them as needed, and incorporate them into their system. This informal reuse takes place irrespective of the development process that is used. However, in the 21st century, software development processes that focus on the reuse of existing software have become widely used. Reuse-oriented approaches rely on a large base of reusable software components and an integrating framework for the composition of these components. Sometimes, these components are systems in their own right (COTS or commercial off-the-shelf systems) that may provide specific functionality such as word processing or a spreadsheet. A general process model for reuse-based development is shown in Figure 2.3. Although the initial requirements specification stage and the validation stage are comparable with other software processes, the intermediate stages in a reuse oriented process are different. These stages are:
Component analysis Given the requirements specification, a search is made for components to implement that specification. Usually, there is no exact match and the components that may be used only provide some of the functionality required.
Requirements modification during this stage, the requirements are analyzed using information about the components that have been discovered. They are then modified to reflect the available components. Where modifications are impossible, the component analysis activity may be reentered to search for alternative solutions.
System design with reuse during this phase, the framework of the system is designed or an existing framework is reused. The designers take into account the components that are reused and organize the framework to cater for this. Some new software may have to be designed if reusable components are not available.
Development and integration Software that cannot be externally procured is developed, and the components and COTS systems are integrated to create the new system. System integration, in this model, may be part of the development process rather than a separate activity.
There are three types of software component that may be used in a reuse-oriented process:
Web services that are developed according to service standards and which are available for remote invocation.
Collections of objects that are developed as a package to be integrated with a component framework such as .NET or J2EE.
Stand-alone software systems that are configured for use in a particular environment.
Reuse-oriented software engineering has the obvious advantage of reducing the amount of software to be developed and so reducing cost and risks. It usually also leads to faster delivery of the software. However, requirements compromises are inevitable and this may lead to a system that does not meet the real needs of users. Furthermore, some control over the system evolution is lost as new versions of the reusable components are not under the control of the organization using them.
Advantages :
It can reduce total cost of software development.
The risk factor is very low.
It can save lots of time and effort.
It is very efficient in nature.
Disadvantages :
Reuse-oriented model is not always worked as a practice in its true form.
Compromises in requirements may lead to a system that does not fulfill requirement of user.
Sometimes using old system component, that is not compatible with new version of component, this may lead to an impact on system evolution.
Process activities
Real software processes are interleaved sequences of technical, collaborative, and managerial activities with the overall goal of specifying, designing, implementing, and testing a software system. Software developers use a variety of different software tools in their work. Tools are particularly useful for supporting the editing of different types of document and for managing the immense volume of detailed information that is generated in a large software project. The four basic process activities of specification, development, validation, and evolution are organized differently in different development processes. In the waterfall model, they are organized in sequence, whereas in incremental development they are interleaved. How these activities are carried out depends on the type of software, people, and organizational structures involved. In extreme programming, for example, specifications are written on cards. Tests are executable and developed before the program itself. Evolution may involve substantial system restructuring or refactoring.
Software specification
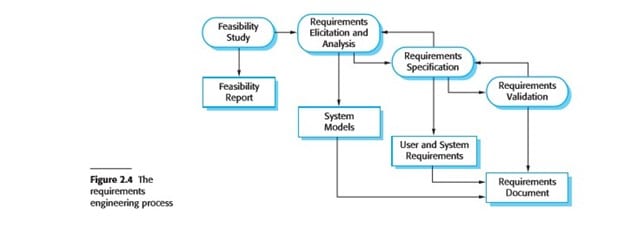
Software specification or requirements engineering is the process of understanding and defining what services are required from the system and identifying the constraints on the system‘s operation and development. Requirements engineering is a particularly critical stage of the software process as errors at this stage inevitably lead to later problems in the system design and implementation. The requirements engineering process (Figure 2.4) aims to produce an agreed requirements document that specifies a system satisfying stakeholder requirements. Requirements are usually presented at two levels of detail. End-users and customers need a high-level statement of the requirements; system developers need a more detailed system specification.
There are four main activities in the requirements engineering process:
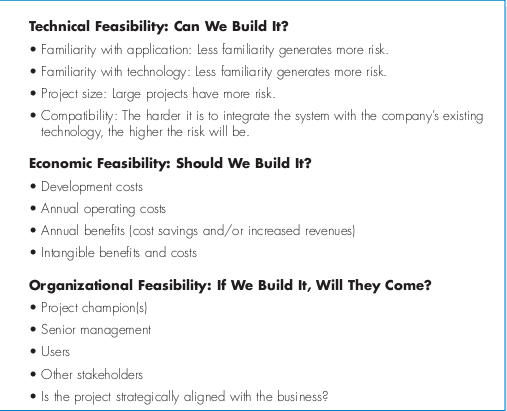
Feasibility study An estimate is made of whether the identified user needs may be satisfied using current software and hardware technologies. The study considers whether the proposed system will be cost-effective from a business point of view and if it can be developed within existing budgetary constraints. A feasibility study should be relatively cheap and quick. The result should inform the decision of whether or not to go ahead with a more detailed analysis.
Requirements elicitation and analysis This is the process of deriving the system requirements through observation of existing systems, discussions with potential users and procurers, task analysis, and so on. This may involve the development of one or more system models and prototypes. These help you understand the system to be specified.
Requirements specification Requirements specification is the activity of translating the information gathered during the analysis activity into a document that defines a set of requirements. Two types of requirements may be included in this document. User requirements are abstract statements of the system requirements for the customer and end-user of the system; system requirements are a more detailed description of the functionality to be provided.
Requirements validation This activity checks the requirements for realism, consistency, and completeness. During this process, errors in the requirements document are inevitably discovered. It must then be modified to correct these problems.
Of course, the activities in the requirements process are not simply carried out in a strict sequence. Requirements analysis continues during definition and specification and new requirements come to light throughout the process. Therefore, the activities of analysis, definition, and specification are interleaved. In agile methods, such as extreme programming, requirements are developed incrementally according to user priorities and the elicitation of requirements comes from users who are part of the development team.
Software Design and implementation
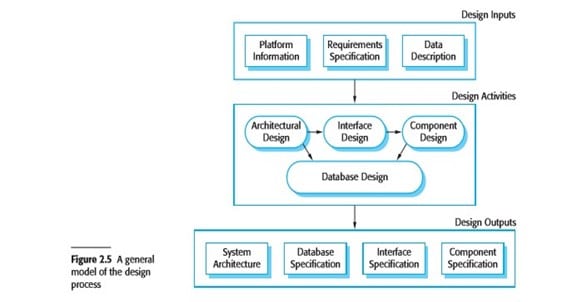
The implementation stage of software development is the process of converting a system specification into an executable system. It always involves processes of software design and programming but, if an incremental approach to development is used, may also involve refinement of the software specification. A software design is a description of the structure of the software to be implemented, the data models and structures used by the system, the interfaces between system components and, sometimes, the algorithms used. Designers do not arrive at a finished design immediately but develop the design iteratively. They add formality and detail as they develop their design with constant backtracking to correct earlier designs. Figure 2.5 is an abstract model of this process showing the inputs to the design process, process activities, and the documents produced as outputs from this process.
The activities in the design process vary, depending on the type of system being developed. For example, real-time systems require timing design but may not include a database so there is no database design involved. Figure 2.5 shows four activities that may be part of the design process for information systems:
Architectural design, where you identify the overall structure of the system, the principal components (sometimes called sub-systems or modules), their relationships, and how they are distributed.
Interface design, where you define the interfaces between system components. This interface specification must be unambiguous. With a precise interface, a component can be used without other components having to know how it is implemented. Once interface specifications are agreed, the components can be designed and developed concurrently.
Component design, where you take each system component and design how it will operate. This may be a simple statement of the expected functionality to be implemented, with the specific design left to the programmer. Alternatively, it may be a list of changes to be made to a reusable component or a detailed design model. The design model may be used to automatically generate an implementation.
Database design, where you design the system data structures and how these are to be represented in a database. Again, the work here depends on whether an existing database is to be reused or a new database is to be created.
These activities lead to a set of design outputs, which are also shown in Figure 2.5.The detail and representation of these vary considerably. For critical systems, detailed design documents setting out precise and accurate descriptions of the system must be produced. If a model-driven approach is used, these outputs may mostly be diagrams. Where agile methods of development are used, the outputs of the design process may not be separate specification documents but may be represented in the code of the program.
Software validation
Software validation or, more generally, verification and validation (V&V) is intended to show that a system both conforms to its specification and that it meets the expectations of the system customer. Program testing, where the system is executed using simulated test data, is the principal validation technique. Validation may also involve checking processes, such as inspections and reviews, at each stage of the software process from user requirements definition to program development. Because of the predominance of testing, the majority of validation costs are incurred during and after implementation.
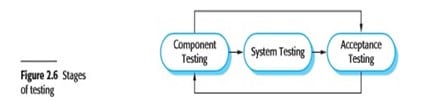
The stages in the testing process are:
Development testing The components making up the system are tested by the people developing the system. Each component is tested independently, without other system components. Components may be simple entities such as functions or object classes, or may be coherent groupings of these entities. Test automation tools, such as JUnit (Massol and Husted, 2003), that can re-run component tests when new versions of the component are created, are commonly used.
System testing System components are integrated to create a complete system. This process is concerned with finding errors that result from unanticipated interactions between components and component interface problems. It is also concerned with showing that the system meets its functional and non-functional requirements, and testing the emergent system properties. For large systems, this may be a multi-stage process where components are integrated to form subsystems that are individually tested before these sub-systems are themselves integrated to form the final system.
Acceptance testing This is the final stage in the testing process before the system is accepted for operational use. The system is tested with data supplied by the system customer rather than with simulated test data. Acceptance testing may reveal errors and omissions in the system requirements definition, because the real data exercise the system in different ways from the test data. Acceptance testing may also reveal requirements problems where the system‘s facilities do not really meet the user‘s needs or the system performance is unacceptable.
Figure 2.6 Testing phases in a plan-driven software process
Normally, component development and testing processes are interleaved. Programmers make up their own test data and incrementally test the code as it is developed. This is an economically sensible approach, as the programmer knows the component and is therefore the best person to generate test cases.
If an incremental approach to development is used, each increment should be tested as it is developed, with these tests based on the requirements for that increment. In extreme programming, tests are developed along with the requirements before development starts. This helps the testers and developers to understand the requirements and ensures that there are no delays as test cases are created.
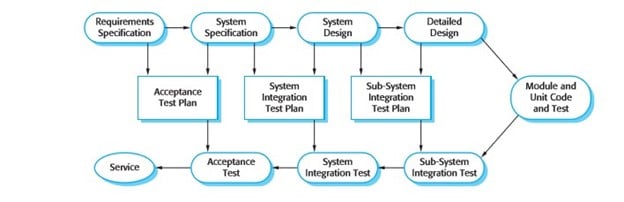
When a plan-driven software process is used (e.g., for critical systems development), testing is driven by a set of test plans. An independent team of testers works from these pre-formulated test plans, which have been developed from the system specification and design. Figure 2.7 illustrates how test plans are the link between testing and development activities. This is sometimes called the V-model of development (turn it on its side to see the V).
Acceptance testing is sometimes called ‗alpha testing‘. Custom systems are developed for a single client. The alpha testing process continues until the system developer and the client agree that the delivered system is an acceptable implementation of the requirements.
When a system is to be marketed as a software product, a testing process called ‗beta testing‘ is often used. Beta testing involves delivering a system to a number of potential customers who agree to use that system. They report problems to the system developers. This exposes the product to real use and detects errors that may not have been anticipated by the system builders. After this feedback, the system is modified and released either for further beta testing or for general sale.
Software evolution
The flexibility of software systems is one of the main reasons why more and more software is being incorporated in large, complex systems. Once a decision has been made to manufacture hardware, it is very expensive to make changes to the hardware design. However, changes can be made to software at any time during or after the system development. Even extensive changes are still much cheaper than corresponding changes to system hardware.
Historically, there has always been a split between the process of software development and the process of software evolution (software maintenance). People think of software development as a creative activity in which a software system is developed from an initial concept through to a working system. However, they sometimes think of software maintenance as dull and uninteresting. Although the costs of maintenance are often several times the initial development costs, maintenance processes are sometimes considered to be less challenging than original software development.
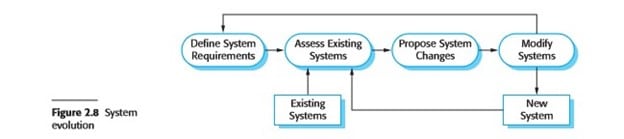
This distinction between development and maintenance is increasingly irrelevant. Hardly any software systems are completely new systems and it makes much more sense to see development and maintenance as a continuum. Rather than two separate processes, it is more realistic to think of software engineering as an evolutionary process (Figure 2.8) where software is continually changed over its lifetime in response to changing requirements and customer needs.
Coping with change
Change is inevitable in all large software projects. The system requirements change as the business procuring the system responds to external pressures and management priorities change. As new technologies become available, new design and implementation possibilities emerge. Therefore whatever software process model is used, it is essential that it can accommodate changes to the software being developed. Change adds to the costs of software development because it usually means that work that has been completed has to be redone. This is called rework. For example, if the relationships between the requirements in a system have been analyzed and new requirements are then identified, some or all of the requirements analysis has to be repeated. It may then be necessary to redesign the system to deliver the new requirements, change any programs that have been developed, and re-test the system.
There are two related approaches that may be used to reduce the costs of rework:
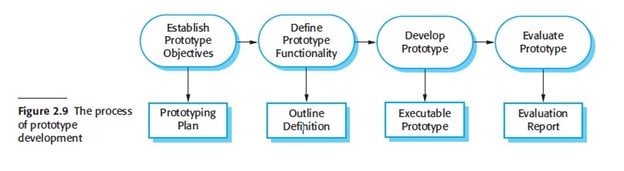
Change avoidance, where the software process includes activities that can anticipate possible changes before significant rework is required. For example, a prototype system may be developed to show some key features of the system to customers. They can experiment with the prototype and refine their requirements before committing to high software production costs.
Change tolerance, where the process is designed so that changes can be accommodated at relatively low cost. This normally involves some form of incremental development. Proposed changes may be implemented in increments that have not yet been developed. If this is impossible, then only a single increment (a small part of the system) may have to be altered to incorporate the change.
Two ways of coping with change and changing system requirements. These are:
System prototyping, where a version of the system or part of the system is developed quickly to check the customer‘s requirements and the feasibility of some design decisions. This supports change avoidance as it allows users to experiment with the system before delivery and so refine their requirements. The number of requirements change proposals made after delivery is therefore likely to be reduced.
Incremental delivery, where system increments are delivered to the customer for comment and experimentation. This supports both change avoidance and change tolerance. It avoids the premature commitment to requirements for the whole system and allows changes to be incorporated into later increments at relatively low cost.
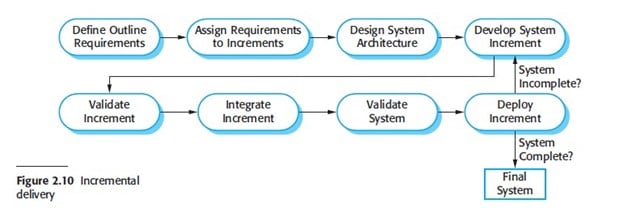
Incremental delivery
Rather than deliver the system y as a single delivery, the development and delivery is broken down into increments with each increment delivering part of the required functionality.
User requirements are prioritized and the highest priority requirements are included in early increments.
Once the development of an increment is started, the requirements are frozen though requirements for later increments can continue to evolve.
Incremental delivery has a number of advantages:
Customers can use the early increments as prototypes and gain experience that informs their requirements for later system increments. Unlike prototypes, these are part of the real system so there is no re-learning when the complete system is available.
Customers do not have to wait until the entire system is delivered before they can gain value from it. The first increment satisfies their most critical requirements so they can use the software immediately.
The process maintains the benefits of incremental development in that it should be relatively easy to incorporate changes into the system.
As the highest-priority services are delivered first and increments then integrated, the most important system services receive the most testing. This means that customers are less likely to encounter software failures in the most important parts of the system.
However, there are problems with incremental delivery:
Most systems require a set of basic facilities that are used by different parts of the system. As requirements are not defined in detail until an increment is to be implemented, it can be hard to identify common facilities that are needed by all increments.
Iterative development can also be difficult when a replacement system is being developed. Users want all of the functionality of the old system and are often unwilling to experiment with an incomplete new system. Therefore, getting useful customer feedback is difficult.
The essence of iterative processes is that the specification is developed in conjunction with the software. However, this conflicts with the procurement model of many organizations, where the complete system specification is part of the system development contract. In the incremental approach, there is no complete system specification until the final increment is specified. This requires a new form of contract, which large customers such as government agencies may find difficult to accommodate.
Prototyping
A prototype is an initial version of a software system that is used to demonstrate concepts, try out design options, and find out more about the problem and its possible solutions. Rapid, iterative development of the prototype is essential so that costs are controlled and system stakeholders can experiment with the prototype early in the software process.
A software prototype can be used in a software development process to help anticipate changes that may be required:
In the requirements engineering process, a prototype can help with the elicitation and validation of system requirements.
In the system design process, a prototype can be used to explore particular software solutions and to support user interface design.
A general problem with prototyping is that the prototype may not necessarily be used in the same way as the final system. The tester of the prototype may not be typical of system users. The training time during prototype evaluation may be insufficient. If the prototype is slow, the evaluators may adjust their way of working and avoid those system features that have slow response times. When provided with better response in the final system, they may use it in a different way. Developers are sometimes pressured by managers to deliver throwaway prototypes, particularly when there are delays in delivering the final version of the software. However, this is usually unwise:
It may be impossible to tune the prototype to meet non-functional requirements, such as performance, security, robustness, and reliability requirements, which were ignored during prototype development.
Rapid change during development inevitably means that the prototype is undocumented. The only design specification is the prototype code. This is not good enough for long-term maintenance.
The changes made during prototype development will probably have degraded the system structure. The system will be difficult and expensive to maintain.
Organizational quality standards are normally relaxed for prototype development.
Boehm’s Spiral model
A risk-driven software process framework (the spiral model) was proposed by Boehm (1988). This is shown in Figure 2.11. Here, the software process is represented as a spiral, rather than a sequence of activities with some backtracking from one activity to another. Each loop in the spiral represents a phase of the software process. Thus, the innermost loop might be concerned with system feasibility, the next loop with requirements definition, the next loop with system design, and so on. The spiral model combines change avoidance with change tolerance. It assumes that changes are a result of project risks and includes explicit risk management activities to reduce these risks. Each loop in the spiral is split into four sectors:
Objective setting: Specific objectives for that phase of the project are defined. Constraints on the process and the product are identified and a detailed management plan is drawn up. Project risks are identified. Alternative strategies, depending on these risks, may be planned.
Risk assessment and reduction: For each of the identified project risks, a detailed analysis is carried out. Steps are taken to reduce the risk. For example, if there is a risk that the requirements are inappropriate, a prototype system may be developed.
Development and validation: After risk evaluation, a development model for the system is chosen. For example, throwaway prototyping may be the best development approach if user interface risks are dominant. If safety risks are the main consideration, development based on formal transformations may be the most appropriate process, and so on. If the main identified risk is sub-system integration, the waterfall model may be the best development model to use.
Planning: The project is reviewed and a decision made whether to continue with a further loop of the spiral. If it is decided to continue, plans are drawn up for the next phase of the project.
The main difference between the spiral model and other software process models is its explicit recognition of risk. A cycle of the spiral begins by elaborating objectives such as performance and functionality. Alternative ways of achieving these objectives, and dealing with the constraints on each of them, are then enumerated. Each alternative is assessed against each objective and sources of project risk are identified. The next step is to resolve these risks by information-gathering activities such as more detailed analysis, prototyping, and simulation. Once risks have been assessed, some development is carried out, followed by a planning activity for the next phase of the process. Informally, risk simply means something that can go wrong. For example, if the intention is to use a new programming language, a risk is that the available compilers are unreliable or do not produce sufficiently efficient object code. Risks lead to proposed software changes and project problems such as schedule and cost overrun, so risk minimization is a very important project management activity.
To introduce software engineering and to explain its importance
To set out the answers to key questions about software engineering
To introduce ethical and professional issues and to explain why they are of concern to software engineers.
Figure 1.1 Frequently asked questions about software
Question
Answer
What is software?
Computer programs and associated documentation. Software products may be developed for a particular customer or may be developed for a general market.
What are the attributes of good software?
Good software should deliver the required Functionality and performance to the user and should be maintainable, dependable, and usable.
What is software engineering?
Software engineering is an engineering discipline that is concerned with all aspects of software production.
What are the fundamental software engineering activities?
Software specification, software development, Software validation and software evolution.
What is the difference between software Engineering and computer science?
Computer science focuses on theory and fundamentals; software engineering is concerned with the practicalities of developing and delivering useful software.
What is the difference between software Engineering and system engineering?
System engineering is concerned with all aspects of computer-based systems development including hardware, software, and process engineering. Software engineering is part of this more general process.
What are the key challenges facing software Engineering?
Coping with increasing diversity, demands for reduced delivery times, and developing trustworthy software.
What are the costs of software engineering?
Roughly 60% of software costs are development costs; 40% are testing costs. For custom software, evolution costs often exceed development costs.
What are the best software engineering techniques and methods?
While all software projects have to be professionally managed and developed, different techniques are appropriate for different types of system. For example, games should always be developed using a series of prototypes whereas safety critical
What is control systems?
control systems require a complete and analyzable specification to be developed. You can‘t, therefore, say that one method is better than another.
What differences has the Web made to software engineering?
The Web has led to the availability of software Services and the possibility of developing highly distributed service-based systems. Web-based systems development has led to important advances in programming languages and software reuse.
Software Product
Software engineers are concerned with developing software products (i.e., software which can be sold to a customer). There are two kinds of software products:
Generic products : These are stand-alone systems that are produced by a development Organization and sold on the open market to any customer who is able to buy them. Examples of this type of product include software for PCs such as databases, word processors, drawing packages, and project-management tools. It also includes so-called vertical applications designed for some specific purpose such as library information systems, accounting systems, or systems for maintaining dental records.
Customized (or bespoke) products: These are systems that are commissioned by a particular customer. A software contractor develops the software especially for that customer. Examples of this type of software include control systems for electronic devices, systems written to support a particular business process, and air traffic control systems.
An important difference between these types of software is that, in generic products, the organization that develops the software controls the software specification. For custom products, the specification is usually developed and controlled by the organization that is buying the software. The software developers must work to that specification. However, the distinction between these system product types is becoming increasingly blurred. More and more systems are now being built with a generic product as a base, which is then adapted to suit the requirements of a customer. Enterprise Resource Planning (ERP) systems, such as the SAP system, are the best examples of this approach. Here, a large and complex system is adapted for a company by incorporating information about business rules and processes, reports required, and so on.
Essential attributes of good software
Product characteristics
Description
Maintainability
Software should be written in such a way so that it can evolve to meet the changing needs of customers. This is a critical attribute because software change is an inevitable requirement of a changing business environment.
Dependability and security
Software dependability includes a range of characteristics including reliability, security, and safety. Dependable software should not cause physical or economic damage in the event of system failure. Malicious users should not be able to access or damage the system.
Efficiency
Software should not make wasteful use of system resources such as memory and processor cycles. Efficiency therefore includes responsiveness, processing time, memory utilization, etc.
Acceptability
Software must be acceptable to the type of users for which it is designed. This means that it must be understandable, usable, and compatible with other systems that they use.
Software engineering
Software engineering is an engineering discipline that is concerned with all aspects of software production from the early stages of system specification through to maintaining the system after it has gone into use. In this definition, there are two key phrases:
Engineering discipline Engineers make things work. They apply theories, methods, and tools where these are appropriate. However, they use them selectively and always try to discover solutions to problems even when there are no applicable theories and methods. Engineers also recognize that they must work to organizational and financial constraints so they look for solutions within these constraints.
All aspects of software production Software engineering is not just concerned with the technical processes of software development. It also includes activities such as software project management and the development of tools, methods, and theories to support software production.
Engineering is about getting results of the required quality within the schedule and budget. This often involves making compromises—engineers cannot be perfectionists. People writing programs for themselves, however, can spend as much time as they wish on the program development. In general, software engineers adopt a systematic and organized approach to their work, as this is often the most effective way to produce high-quality software. However, engineering is all about selecting the most appropriate method for a set of circumstances so a more creative, less formal approach to development may be effective in some circumstances. Less formal development is particularly appropriate for the development of web-based systems, which requires a blend of software and graphical design skills.
Software engineering is important for two reasons:
More and more, individuals and society rely on advanced software systems. We need to be able to produce reliable and trustworthy systems economically and quickly.
It is usually cheaper, in the long run, to use software engineering methods and techniques for software systems rather than just write the programs as if it was a personal programming project. For most types of systems, the majority of costs are the costs of changing the software after it has gone into use.
Software process
The systematic approach that is used in software engineering is sometimes called a software process. A software process is a sequence of activities that leads to the production of a software product. There are four fundamental activities that are common to all software processes. These activities are:
Software specification, where customers and engineers define the software that is to be produced and the constraints on its operation.
Software development, where the software is designed and programmed.
Software validation, where the software is checked to ensure that it is what the customer requires.
Software evolution, where the software is modified to reflect changing customer and market requirements.
Software engineering is related to both computer science and systems engineering:
Computer science is concerned with the theories and methods that underlie computers and software systems, whereas software engineering is concerned with the practical problems of producing software. Some knowledge of computer science is essential for software engineers in the same way that some knowledge of physics is essential for electrical engineers. Computer science theory, however, is often most applicable to relatively small programs. Elegant theories of computer science cannot always be applied to large, complex problems that require a software solution.
System engineering is concerned with all aspects of the development and evolution of complex systems where software plays a major role. System engineering is therefore concerned with hardware development, policy and process design and system deployment, as well as software engineering. System engineers are involved in specifying the system, defining its overall architecture, and then integrating the different parts to create the finished system. They are less concerned with the engineering of the system components (hardware, software etc.).
General Issues that affect many Software
There are many different types of software. There is no universal software engineering method or technique that is applicable for all of these. However, there are three general issues that affect many different types of software:
Heterogeneity increasingly, systems are required to operate as distributed systems across networks that include different types of computer and mobile devices. As well as running on general-purpose computers, software may also have to execute on mobile phones. You often have to integrate new software with older legacy systems written in different programming languages. The challenge here is to develop techniques for building dependable software that is flexible enough to cope with this heterogeneity.
Business and social change Business and society are changing incredibly quickly as emerging economies develop and new technologies become available. They need to be able to change their existing software and to rapidly develop new software. Many traditional software engineering techniques are time consuming and delivery of new systems often takes longer than planned. They need to evolve so that the time required for software to deliver value to its customers is reduced.
Security and trustAs software is intertwined with all aspects of our lives, it is essential that we can trust that software. This is especially true for remote software systems accessed through a web page or web service interface. We have to make sure that malicious users cannot attack our software and that information security is maintained.
This radical change in software organization has, obviously, led to changes in the ways that web-based systems are engineered. For example:
Software reuse has become the dominant approach for constructing web-based systems. When building these systems, you think about how you can assemble them from pre-existing software components and systems.
It is now generally recognized that it is impractical to specify all the requirements for such systems in advance. Web-based systems should be developed and delivered incrementally.
User interfaces are constrained by the capabilities of web browsers. Although technologies such as AJAX (Holdener, 2008) mean that rich interfaces can be created within a web browser, these technologies are still difficult to use. Web forms with local scripting are more commonly used. Application interfaces on web-based systems are often poorer than the specially designed user interfaces on PC system products.
Software engineering ethics
Confidentiality You should normally respect the confidentiality of your employers or clients irrespective of whether or not a formal confidentiality agreement has been signed.
Competence You should not misrepresent your level of competence. You should not knowingly accept work that is outside your competence.
Intellectual property rights You should be aware of local laws governing the use of intellectual property such as patents and copyright. You should be careful to ensure that the intellectual property of employers and clients is protected.
Computer misuse You should not use your technical skills to misuse other people‘s computers. Computer misuse ranges from relatively trivial (game playing on an employer‘s machine, say) to extremely serious (dissemination of viruses or other malware).
ACM/IEEE Code of Ethics
The professional societies in the US have cooperated to produce a code of ethical practice.
Members of these organizations sign up to the code of practice when they join.
The Code contains eight Principles related to the behavior of and decisions made by professional software engineers, including practitioners, educators, managers, supervisors and policy makers, as well as trainees and students of the profession.
Code of ethics – preamble
PREAMBLE
The short version of the code summarizes aspirations at a high level of the abstraction; the clauses that are included in the full version give examples and details of how these aspirations change the way we act as software engineering professionals. Without the aspirations, the details can become legalistic and tedious; without the details, the aspirations can become high sounding but empty; together, the aspirations and the details form a cohesive code. Software engineers shall commit themselves to making the analysis, specification, design, development, testing and maintenance of software a beneficial and respected profession. In accordance with their commitment to the health, safety and welfare of the public, software engineers shall adhere to the following
Eight Principles of software engineers:
PUBLIC — Software engineers shall act consistently with the public interest.
CLIENT AND EMPLOYER — Software engineers shall act in a manner that is in the
Best interests of their client and employer consistent with the public interest.
PRODUCT — Software engineers shall ensure that their products and related
Modifications meet the highest professional standards possible.
JUDGMENT — Software engineers shall maintain integrity and independence in their Professional judgment.
MANAGEMENT — Software engineering managers and leaders shall subscribe to and promote an ethical approach to the management of software development and maintenance.
PROFESSION — Software engineers shall advance the integrity and reputation of the profession consistent with the public interest.
COLLEAGUES — Software engineers shall be fair to and supportive of their colleagues.
SELF — Software engineers shall participate in lifelong learning regarding the practice of their profession and shall promote an ethical approach to the practice of the profession.
.Ethical dilemmas
Disagreement in principle with the policies of senior management.
Your employer acts in an unethical way and releases a safety critical system without finishing the testing of the system.
Participation in the development of military weapons systems or nuclear systems.
Case studies
The three types of systems that I use as case studies are:
An embedded system This is a system where the software controls a hardware device and is embedded in that device. Issues in embedded systems typically include physical size, responsiveness, power management, etc. The example of an embedded system that I use is a software system to control a medical device.
An information system This is a system whose primary purpose is to manage and provide access to a database of information. Issues in information systems include security, usability, privacy, and maintaining data integrity. The example of an information system that I use is a medical records system.
A sensor-based data collection system This is a system whose primary purpose is to collect data from a set of sensors and process that data in some way. The key requirements of such systems are reliability, even in hostile environmental conditions, and maintainability. The example of a data collection system that I use is a wilderness weather station.
Homework
Study Three types of case studies (Ref: software engineering , Ian Sommerville)
Make Groups (4 Members) and Give a presentation on your selected topics on next class! .
The project scheduleis the tool that communicates what work needs to be performed, which resources of the organization will perform the work and the timeframes in which that work needs to be performed.
The project scheduleshould reflect all of the work associated with delivering the project on time.
In project management, a scheduleis a listing of a project’s milestones, activities, and deliverables, usually with intended start and finish dates.
What is a Gantt chart?
A chart in which a series of horizontal lines shows the amount of work done or production completed in certain periods of time in relation to the amount planned for those periods.
To summarize, a Gantt chart shows you what has to be done (the activities) and when (the schedule).
Gantt charts make it easy to visualize project management timelines by transforming task names, start dates, durations, and end dates into cascading horizontal bar charts.
How a Gantt chart look like?
A Gantt chart, commonly used in project management, is one of the most popular and useful ways of showing activities (tasks or events) displayed against time.
On the left of the chart is a list of the activities and along the top is a suitable time scale.
Each activity is represented by a bar; the position and length of the bar reflects the start date, duration and end date of the activity.
Gantt Chart represents..!
What the various activities are?
When each activity begins and ends?
How long each activity is scheduled to last?
Where activities overlap with other activities, and by how much?
The start and end date of the whole project?
Advantages of Gantt Charts
It creates a understandable picture of complexity.if we can see complex ideas as a picture, this will help our understanding.
It organizes your thoughts.It represents the concept of dividing and conquering. A big problem is conquered by dividing it into component parts.
It demonstrates that you know what you’re doing.When you produce a nicely presented Gantt chart with high level tasks properly organized and resources allocated to those tasks, it speaks volumes about whether you are on top of the needs of the project and whether the project will be successful.
It helps you to set realistic time frames.The bars on the chart indicate in which period a particular task or set of tasks will be completed. This can help you to get things in perspective properly. And when you do this, make sure that you think about events in your organization that have nothing to do with this project that might consume resources and time.
It can be highly visible.It can be useful to place the chart, or a large version of it, where everyone can see it. This helps to remind people of the objectives and when certain things are going to happen. It is useful if everyone in your enterprise can have a basic level of understanding of what is happening with the project even if they may not be directly involved with it.
Disadvantages of Gantt Charts
They can become extraordinarily complex.Except for the most simple projects, there will be large numbers of tasks undertaken and resources employed to complete the project.
The size of the bar does not indicate the amount of work.Each bar on the chart indicates the time period over which a particular set of tasks will be completed. However, by looking at the bar for a particular set of tasks, you cannot tell what level of resources are required to achieve those tasks. So, a short bar might take 500 man hours while a longer bar may only take 20 man hours.
They need to be constantly updated.As you get into a project, things will change. If you’re going to use a Gantt chart you must have the ability to change the chart easily and frequently.
It does not identify potential weak links between phases . Whenever work is transferred from one person or department to another, your project is subject to potential delay. These weak links are the most common causes of delays.
It does not reveal the problems your team will encounter due to unexpected delays. The Gantt chartshows only the planned and actual start and completion dates for each phase. It gives you a quick visual overview of the project’s status, but you might need more. The chart does not show how a delay during one phase will impact on the completion of another.
It does not coordinate the resources or networking requirements needed at critical points in the schedule. Many projects can proceed only when forms, documents, reports, outside help, and other requirements are either developed by your team or supplied by someone else. Thus, a complete schedule should identify these critical points and enable you to plan ahead for the related demands. The Gantt chart does not provide this much detail.
PERT chart (Program Evaluation Review Technique)
A PERT chart presents a graphic illustration of a project as a network diagram consisting of numbered nodes(either circles or rectangles) representing events, or milestones in the project linked by labelled vectors (directional lines) representing tasks in the project.
The direction of the arrows on the lines indicates the sequence of tasks.
An analysisand evaluation of a proposed project to determine if it (1) is technically feasible, (2) is feasible within the estimated cost, and (3) will be profitable for Organization.
Feasibility analysis guides the organization in determining whether to proceed with the project.
Feasibility analysis also identifies the important risks associated with the project that must be managed if the project is approved.
Types in Feasibility: As with the system request, each organization has its own process and format for the feasibility analysis, but most include techniques to assess three areas:
Technical Feasibility,
Economic Feasibility, and
Organizational Feasibility
Technical Feasibility?
Technical Feasibility: Can We Build It?
Familiarity with application: Less familiarity generates more risk.
Familiarity with technology: Less familiarity generates more risk.
Project size: Large projects have more risk.
Compatibility: The harder it is to integrate the system with the company’s existing technology, the higher the risk will be.
Organizational Feasibility: If We Build It, Will They Come?
Project champion(s)
Senior management
Users
Other stakeholders
Is the project strategically aligned with the business?
Technical Feasibility
The first technique in the feasibility analysis is to assess the technical feasibility of the project, the extent to which the system can be successfully designed, developed, and installed by the IT group.
Technical feasibility analysis is, in essence, a technical risk analysis that strives to answer the question: “ Can we build it?”
Familiarity with the application
First and foremost is the users’ and analysts’ familiarity with the application.
When analysts are unfamiliar with the business application area, they have a greater chance of misunderstanding the users or missing opportunities for improvement.
The risks increase dramatically when the users themselves are less familiar with an application.
When a system will use technology that has not been used before within the organization, there is a greater chance that problems and delays will occur because of the need to learn how to use the technology.
Risk increases dramatically when the technology itself is new.
Project size
Project size is an important consideration, whether measured as the number of people on the development team, the length of time it will take to complete the project, or the number of distinct features in the system.
Larger projects present more risk, because they are more complicated to manage and because there is a greater chance that some important system requirements will be overlooked or misunderstood.
Compatibility
Systems rarely are built in a vacuum—they are built in organizations that have numerous systems already in place.
New technology and applications need to be able to integrate with the existing environment for many reasons.
They may rely on data from existing systems, they may produce data that feed other applications, and they may have to use the company’s existing communications infrastructure.
A new system has little value if it does not use customer data found across the organization in existing sales systems, marketing applications, and customer service systems.
Economic Feasibility
Economic feasibility analysis also called a cost–benefit analysis.
This attempts to answer the question “Should we build the system?”
Economic feasibility is determined by identifying costs and benefits associated with the system, assigning values to them, calculating future cash flows, and measuring the financial worthiness of the project.
Keep in mind that organizations have limited capital resources and multiple projects will be competing for funding.
Steps to Conduct an Economic Feasibility Analysis
Identify Costs and Benefits
List the tangible costs and benefits for the project.
Include both one-time and recurring costs.
Assign Values to Costs and Benefits
Work with business users and IT professionals to create numbers for each of the costs and benefits.
Even intangibles should be valued if at all possible.
Determine Cash Flow
Forecast what the costs and benefits will be over a certain period, usually, three to five years.
Apply a growth rate to the values, if necessary.
Assess Project’s Economic Value
Evaluate the project’s expected returns in comparison to its costs.
Use one or more of the following evaluation techniques:
Assess Project’s Economic Value
Return on Investment (ROI)
Calculate the rate of return earned on the money invested in the project, using the ROI formula.
Break-Even Point (BEP)
Find the year in which the cumulative project benefits exceed cumulative project costs.
Apply the breakeven formula, using figures for that year.
This calculation measures how long it will take for the system to produce benefits that cover its costs.
iii. Net Present Value (NPV)
Restate all costs and benefits in today’s dollar terms(present value), using an appropriate discount rate.
Determine whether the total present value of benefits is greater than or less than the total present value of costs.
Identify Costs and Benefits
The systems analyst’s first task when developing an economic feasibility analysis is to identify the kinds of costs and benefits the system will have and list them.
The costs and benefits can be broken down into four categories:
(1) Development Costs,
(2) Operational Costs,
(3) Tangible Benefits, and
(4) Intangible Benefits.
Development costs
Development costs are those tangible expenses that are incurred during the creation of the system, such as salaries for the project team, hardware and software expenses, consultant fees, training, and office space and equipment.
Development costs are usually thought of as one-time costs.
Operational costs
Operational costs are those tangible costs that are required to operate the system, such as the salaries for operations staff, software licensing fees, equipment upgrades, and communications charges.
Operational costs are usually thought of as ongoing costs
Tangible benefits
Tangible benefits include revenue that the system enables the organization to collect, such as increased sales.
Tangible benefits include revenue that the system enables the organization to collect, such as increased sales.
Assign Values to Costs and Benefits
Once the types of costs and benefits have been identified, the analyst needs to assign specific BDT values to them.
This may seem impossible—How can someone quantify costs and benefits that haven’t happened yet? And how can those predictions be realistic?
The most effective strategy for estimating costs and benefits is to rely on the people who have the best understanding of them.
Cash Flow Analysis and Measures
IT projects commonly involve an initial investment that produces a stream of benefits over time, along with some ongoing support costs.
Cash flows, both inflows and outflows, are estimated over some future period.
In this simple example, a system is developed in Year 0 (the current year) costing $100,000. Once the system is operational, benefits and on-going costs are projected over three years.
Return on Investment(ROI)
The return on investment (ROI) is a calculation that measures the average rate of return earned on the money invested in the project.
ROI is a simple calculation that divides the project’s net benefits (total benefits – total costs) by the total costs.
A high ROI suggests that the project’s benefits far outweigh the project’s cost, although exactly what constitutes a “high” ROI is unclear.
Break-Even Point
The break-even point (also called the payback method ) is defined as the number of years it takes a firm to recover its original investment in the project from net cash flows.
In this example, the project’s cumulative cash flow figure becomes positive during Year 3, so the initial investment is “paid back” over two years plus some fraction of the year 3.
Discounted Cash Flow Technique
Discounted cash flows are used to compare the present value of all cash inflows and outflows for the project in today’s BDT terms.
A BDT received in the future is worth less than a BDT received today, since you forgo that potential return.
Discounted Cash Flow Projection
Net Present Value (NPV)
The NPV is simply the difference between the total present value of the benefits and the total present value of the costs.
As long as the NPV is greater than zero, the project is considered economically acceptable.
Net Present Value (NPV)
Unfortunately for this project, the NPV is less than zero, indicating that for a required rate of return of 10%, this project should not be accepted.
The required rate of return would have to be something less than 6.65% before this project returns a positive NPV.
OrganizationalFeasibility
The final technique used for feasibility analysis is to assess the organizational feasibility of the system: how well the system ultimately will be accepted by its users and incorporated into the ongoing operations of the organization.
One way to assess the organizational feasibility of the project is to understand how well the goals of the project align with business objectives.
A second way to assess organizational feasibility is to conduct a stakeholder analysis.
A stakeholder is a person, group, or organization that can affect (or can be affected by) a new system.
The most important stakeholders in the introduction of a new system are the project champion, system users, and organizational management.
Try yourself
Think about the idea that you developed to improve your university course enrollment process.
QUESTIONS :
List three things that influence the technical feasibility of the system.
List three things that influence the economic feasibility of the system.
List three things that influence the organizational feasibility of the system.
How can you learn more about the issues that affect the three kinds of feasibility?
A data flow diagram (DFD) is a graphical representation of the “flow” of data through an information system, modelling its process aspects.
A DFD is often used as a preliminary step to create an overview of the system, which can later be elaborated.
Show users how data moves between different processes in a system.
Figure 1: DFD
Symbols and Notations Used in DFDs: • Two common systems of symbols are named after their creators: • Yourdon and Coad • Yourdon and DeMarco • Gane and Sarson • One main difference in their symbols is that Yourdon-Coad and Yourdon-DeMarco use circles for processes, while Gane and Sarson use rectangles with rounded corners, sometimes called lozenges. • There are other symbol variations in use as well, so the important thing to keep in mind is to be clear and consistent in the shapes and notations you use to communicate and collaborate with others. Using any convention’s DFD rules or guidelines, the symbols depict the four components of data flow diagrams.• External entity: an outside system that sends or receives data, communicating with the system being diagrammed. • They are the sources and destinations of information entering or leaving the system. • They might be an outside organization or person, a computer system or a business system. • They are also known as terminators, sources and sinks or actors.
They are typically drawn on the edges of the diagram.
• Process: any process that changes the data, producing an output. • It might perform computations, or sort data based on logic, or direct the data flow based on business rules. • A short label is used to describe the process, such as “Submit payment.”• Data store: files or repositories that hold information for later use, such as a database table or a membership form. • Each data store receives a simple label, such as “Orders.”• Data flow: the route that data takes between the external entities, processes and data stores. • It portrays the interface between the other components and is shown with arrows, typically labeled with a short data name, like “Billing details.”Figure: DFD element features
DFD rules and tips
Each process should have at least one input and an output.
Each data store should have at least one data flow in and one data flow out.
Data stored in a system must go through a process.
All processes in a DFD go to another process or a data store.
Each process should have at least one input and an output.
Each data store should have at least one data flow in and one data flow out.
Data stored in a system must go through a process.
All processes in a DFD go to another process or a data store.
DFD levels and layers: From context diagrams to pseudocode
A data flow diagram can dive into progressively more detail by using levels and layers, zeroing in on a particular piece.
DFD levels are numbered 0, 1 or 2, and occasionally go to even Level 3 or beyond.
The necessary level of detail depends on the scope of what you are trying to accomplish.
DFD Level 0
DFD Level 0 is also called a Context Diagram.
It’s a basic overview of the whole system or process being analyzed or modeled.
It’s designed to be an at-a-glance view, showing the system as a single high-level process, with its relationship to external entities.
It should be easily understood by a wide audience, including stakeholders, business analysts, data analysts and developers.
DFD Level 1
DFD Level 1 provides a more detailed breakout of pieces of the Context Level Diagram.
You will highlight the main functions carried out by the system, as you break down the high-level process of the Context Diagram into its sub processes.
DFD Level 2 • DFD Level 2 then goes one step deeper into parts of Level 1. • It may require more text to reach the necessary level of detail about the system’s functioning. • Progression to Levels 3, 4 and beyond is possible, but going beyond Level 3 is uncommon. • Doing so can create complexity that makes it difficult to communicate, compare or model effectively.Figure: Context Diagram
Context Diagram For Level 0 Diagram
Level 0 Diagram
Context Diagram For Level 1 Diagram
Level 1 DFD for Process 2
Context Diagram For Level 2 Diagram
Level 2 DFD for Process 2.2
Context Diagram For Level 1, 2, 0 Diagram
Process
• Every process has a unique name that is an action-oriented verb phrase, a number, and a description.
• Every process has at least one input data flow.
• Every process has at least one output data flow.
• Output data flows usually have different names than input data flows because the process changes the
input into a different output in some way.
• There are between three and seven processes per DFD
Data Flow
• Every data flow has a unique name that is a noun, and a description.
• Every data flow connects to at least one process.
• Data flows only in one direction (no two-headed arrows).
• A minimum number of data flow lines cross.
Data Store
• Every data store has a unique name that is a noun, and a description.
• Every data store has at least one input data flow (which means to add new data or change existing
data in the data store) on some page of the DFD.
• Every data store has at least one output data flow (which means to read data from the data store) on
some page of the DFD.
External Entity
• Every external entity has a unique name that is a noun, and a description.
• Every external entity has at least one input or output data flow.
Within DFD all the elements with features
Across DFDs :
Errors in DFD:
An entity cannot provide data to another entity without some processing occurred.
Data cannot move directly from an entity to a data story without being processed.
Data cannot move directly from a data store without being processed.
Data cannot move directly from one data store to another without being processed.
Other frequently-made mistakes in DFD A second class of DFD mistakes arise when the outputs from one processing step do not match its inputs and they can be classified as:
Black holes: A processing step may have input flows but no output flows.
Miracles: A processing step may have output flows but no input flows.
Grey holes: A processing step may have outputs that are greater than the sum of its inputs
In most organizations, project initiation begins by preparing a
system request.
A system request is a document that describes the business reasons for building a system and the value that the system is expected to provide.
The project sponsor usually completes this form as part of a formal system project selection process within the organization.
Most system requests include five elements:
Project Sponsor,
Business Need,
Business Requirements,
Business Value, and
Special Issues.
Project Sponsor?
The sponsor describes the person who will serve as the primary contact for the project.
Business Need
The business need presents the reasons prompting the project.
Business Requirements
The business requirements of the project refer to the business capabilities that the system will need to have.
Business Value
Business value describes the benefits that the organization should expect from the system.
Special Issues
Special issues are included on the document as a catchall category for other information that should be considered in assessing the project.
For example, the project may need to be completed by a specific deadline.
Applying the Concepts…!
Tune Source is a company headquartered in Dhaka.
Tune Source is the brainchild of three entrepreneurs with ties to the music industry: John, Megan, and Phil.
Tune Source quickly became known as the place to go to find rare audio recordings.
Annual sales last year were BDT 2 million with annual growth at about 3%–5% per year.
Case study
John, Megan, and Phil, like many others in the music industry, watched with alarm the rise of music-sharing websites like Napster, as music consumers shared digital audio files without paying for them, denying artists and record labels royalties associated with sales. Once the legal battle over copyright infringement was resolved and Napster was shut down, the partners set about establishing agreements with a variety of industry partners in order to offer a legitimate digital music download resource for customers in their market niche.
Phil has asked Carly Edwards, a rising star in the Tune Source department, to spearhead the digital music download project.
Tune Source currently has a website that enables customers to search for and purchase CDs. This site was initially developed by an Internet consulting firm and is hosted by a prominent local Internet Service Provider (ISP) in Dhaka. The IT department at Tune Source has become experienced with Internet technology as it has worked with the ISP to maintain the site.
Sales Projection
Create A System Request? (Assignment)
Think about your varsity and choose an idea that could improve student satisfaction with the course enrollment process. Currently, can students enroll for classes from anywhere? How long does it take? Are directions simple to follow? Is online help available?
Next, think about how technology can help support your idea. Would you need completely new technology? Can the current system be changed?
Question:
Create a system request that you could give to the administration that explains the sponsor, business need, business requirements, and potential value of the project. Include any constraints or issues that should be considered.
The Result?
The committee reviews the system request and makes an initial determination, based on the information provided, of whether to investigate the proposed project or not.
If so, the next step is to conduct a feasibility analysis.
The principles of user interface design are intended to improve the quality of user interface design.
According to Larry Constantine and Lucy Lockwood in their usage-centered design, these principles are:
The structure principle: Design should organize the user interface purposefully, in meaningful and useful ways based on clear, consistent models that are apparent and recognizable to users, putting related things together and separating unrelated things, differentiating dissimilar things and making similar things resemble one another. The structure principle is concerned with overall user interface architecture.
The simplicity principle: The design should make simple, common tasks easy, communicating clearly and simply in the user’s own language, and providing good shortcuts that are meaningfully related to longer procedures.
The visibility principle: The design should make all needed options and materials for a given task visible without distracting the user with extraneous or redundant information. Good designs don’t overwhelm users with alternatives or confuse with unneeded information.
The feedback principle: The design should keep users informed of actions or interpretations, changes of state or condition, and errors or exceptions that are relevant and of interest to the user through clear, concise, and unambiguous language familiar to users.
The tolerance principle: The design should be flexible and tolerant, reducing the cost of mistakes and misuse by allowing undoing and redoing, while also preventing errors wherever possible by tolerating varied inputs and sequences and by interpreting all reasonable actions.
The reuse principle: The design should reuse internal and external components and behaviors, maintaining consistency with purpose rather than merely arbitrary consistency, thus reducing the need for users to rethink and remember.
UX and UI Design
UX design is a more analytical and technical field, UI design is closer to what we refer to as graphic design.
What is User Experience Design?
User experience design (UXD or UED) is the process of enhancing customer satisfaction and loyalty by improving the usability, ease of use, and pleasure provided in the interaction between the customer and the product.
User experience encompasses all aspects of the end-user’s interaction with the company, its services, and its products.
User experience design is the process of development and improvement of quality interaction between a user and all facets of a company.
User experience design is responsible for being hands on with the process of research, testing, development, content, and prototyping to test for quality results.
User experience design is in theory a non-digital (cognitive science) practice, but used and defined predominantly by digital industries.
What is UI Design?
User Interface Design is responsible for the transference of a brand’s strengths and visual assets to a product’s interface as to best enhance the user’s experience.
User Interface Design is a process of visually guiding the user through a product’s interface via interactive elements and across all sizes/platforms.
User Interface Design is a digital field, which includes responsibility for cooperation and work with developers or code.
What is The Difference Between UX and UI Design?
UX designer is like architect. He takes care of users and helps your business to improve measurable parameters (reduce bounce rate, improve CTR, etc.)
he knows a lot about interface ergonomics
he understands user’s behavior and psychology
he analyzes business needs and converts it into user flows.
UI designer is like decorator/interior designer. He takes care of how the interface reflects your brand’s mission, using the brand visual style. It’s more about unmeasurable things (how cozy an interface is, is it stylish enough, etc.)
he knows a lot and ‘feels’ colors and color combinations
he can read brand books and convert it into UI elements
he creates small ‘visual candies’ (pictograms, etc.) and UI animations (now it’s the must have skill).
Implementation Phases
Coding: Includes implementation of the design specified in the design document into executable programming language code. The output of the coding phase is the source code for the software that acts as input to the testing and maintenance phase.
Integration and Testing: Includes detection of errors in the software. The testing process starts with a test plan that recognizes test-related activities, such as test case generation, testing criteria, and resource allocation for testing. The code is tested and mapped against the design document created in the design phase. The output of the testing phase is a test report containing errors that occurred while testing the application.
Installation: In this stage the new system is installed and rolled out.
The systems development life cycle (SDLC), also referred to as the application development life-cycle, is a term used in systems engineering, information systems and software engineering to describe a process for planning, creating, testing, and deploying an information system.
Career Paths for System Developers
Systems Development Life Cycle
Building an information system using the SDLC follows a similar set of four fundamental phases:
Planning,
Analysis,
Design,
Implementation
The Systems Development Life Cycle
Each phase is itself composed of a series of steps , which rely on techniques that produce deliverables (specific documents and files that explain various elements of the system).
Planning
The planning phase is the fundamental process of understanding why an information system should be built and determining how the project team will go about building it. It has two steps:
1. Project initiation
2. Project management
Project initiation
During project initiation , the system’s business value to the organization is identified—how will it lower costs or increase revenues?
The IS department works to conduct a feasibility analysis. The feasibility analysis examines key aspects of the proposed project:
■ The technical feasibility (Can we build it?)
■ The economic feasibility (Will it provide business value?)
■ The organizational feasibility (If we build it, will it be used?)
The system request and feasibility analysis are presented to an information systems approval committee (sometimes called a steering committee ), which decides whether the project should be undertaken.
Project management
Once the project is approved, it enters project management.
During project management, the project manager creates a work plan, staffs the project, and puts techniques in place to help the project team control and direct the project through the entire SDLC.
The deliverable for project management is a project plan that describes how the project team will go about developing the system
The analysis phase answers the questions of who will use the system?, what the system will do?, and where and when it will be used?
During this phase, the project team investigates any current system(s), identifies improvement opportunities, and develops a concept for the new system. This phase has three steps:
Analysis strategy
Requirements gathering
System proposal
Analysis strategy
An analysis strategy is developed to guide the project team’s efforts.
Such a strategy usually includes a study of the current system (called the as-is system ) and its problems, and envisioning ways to design a new system (called the to-be system ).
Requirements gathering
The next step is requirements gathering (e.g., through interviews, group work-shops, or questionnaires).
The analysis of this information leads to the development of a concept for a new system.
The system concept is then used as a basis to develop a set of business analysis models that describes how the business will operate if the new system were developed.
System proposal
The analyses, system concept, and models are combined into a document called the system proposal , which is presented to the project sponsor and other key decision makers (e.g., members of the approval committee) who will decide whether the project should continue to move forward.
Design
The design phase decides how the system will operate in terms of the hardware, software, and network infrastructure that will be in place; the user interface, forms, and reports that will be used; and the specific programs, databases, and files that will be needed.
The design phase has four steps:
Design strategy
Architecture design
Database and file specifications
Program design
Design strategy
This clarifies whether the system will be developed by the company’s own programmers, whether its development will be outsourced to another firm (usually a consulting firm), or whether the company will buy an existing software package.
Architecture design
This leads to the development of the basic architecture design for the system that describes the hardware, software, and network infrastructure that will be used.
The interface design specifies how the users will move through the system (e.g., by navigation methods such as menus and on-screen buttons) and the forms and reports that the system will use.
Database and file specifications
These define exactly what data will be stored and where they will be stored.
Program design
The analyst team develops the program design, which defines the programs that need to be written and exactly what each program will do.
To sum up…
This collection of deliverables (architecture design, interface design, database and file specifications, and program design) is the system specification that is used by the programming team for implementation.
At the end of the design phase, the feasibility analysis and project plan are reexamined and revised, and another decision is made by the project sponsor and approval committee about whether to terminate the project or continue.
Implementation • The final phase in the SDLC is the implementation phase , during which the system is actually built (or purchased, in the case of a packaged software design and installed). • It is the longest and most expensive single part of the development process. This phase has three steps: • System construction • Installation • Supportive plan System construction • The system is built and tested to ensure that it performs as designed. • Since the cost of fixing bugs can be immense, testing is one of the most critical steps in implementation. • Most organizations spend more time and attention on testing than on writing the programs in the first place. Installation • Installation is the process by which the old system is turned off and the new one is turned on. Supportive plan • This plan usually includes a formal or informal post-implementation review, as well as a systematic way for identifying major and minor changes needed for the system.
Once upon a time, software development consisted of a programmer writing code to solve a problem or automate a procedure. Nowadays, systems are so big and complex that teams of architects, analysts, programmers, testers and users must work together to create the millions of lines of custom-written code that drive our enterprises.
To manage this, a number of system development life cycle (SDLC) models have been created: waterfall, fountain, spiral, build and fix, rapid prototyping, incremental, and synchronize and stabilize.
What is SDLC?
The systems development life cycle (SDLC) is the process of determining how an information system (IS) can support business needs, designing the system, building it, and delivering it to users.
SDLC cycle
The systems development life cycle (SDLC), also referred to as the application development life-cycle, is a term used in systems engineering, information systems and software engineering to describe a process for planning, creating, testing, and deploying an information system.
SDLC key person?
The key person in the SDLC is the systems analyst, who analyzes the business situation, identifies opportunities for improvements, and designs an information system to implement the improvements.
THE SYSTEMS ANALYST
The systems analyst plays a key role in information systems development projects.
The systems analyst works closely with all project team members so that the team develops the right system in an effective way.
Systems analysts must understand how to apply technology to solve business problems.
In addition, systems analysts may serve as change agents who identify the organizational improvements needed, design systems to implement those changes, and train and motivate others to use the systems.
Systems Analyst Skills
Skills can be broken down into six major categories:
TECHNICAL skill,
BUSINESS skill,
ANALYTICAL skill,
INTERPERSONAL skill,
MANAGEMENT skill,
ETHICAL issue.
Technical skills
Analysts must have the technical skills to understand the organization’s existing technical environment, the new system’s technology foundation, and the way in which both can be fit into an integrated technical solution.
Business skills
Business skills are required to understand how IT can be applied to business situations and to ensure that the IT delivers real business value.
Analytical skills
Analysts are continuous problem solvers at both the project and the organizational level, and they put their analytical skills to the test regularly.
Interpersonal skills
Often, analysts need to communicate effectively, one-on-one with users and business managers (who often have little experience with technology) and with programmers (who often have more technical expertise than the analyst does).
They must be able to give presentations to large and small groups and to write reports.
Management skills
They also need to manage people with whom they work, and they must manage the pressure and risks associated with unclear situations.
Ethical issues
Finally, analysts must deal fairly, honestly, and ethically with other project team members, managers, and system users.
Analysts often deal with confidential information or information that, if shared with others, could cause harm (e.g., dissent among employees); it is important for analysts to maintain confidence and trust with all people.
Systems Analyst Roles
The roles and the names used to describe them may vary from organization to organization.
Systems analyst role
The systems analyst role focuses on the IS issues surrounding the system.
This person develops ideas and suggestions for ways that IT can support and improve business processes, helps design new business processes supported by IT, designs the new information system, and ensures that all IS standards are maintained.
The systems analyst will have significant training and experience in analysis and design and in programming.
Business analyst role
The business analyst role focuses on the business issues surrounding the system.
This person helps to identify the business value that the system will create, develops ideas for improving the business processes, and helps design new business processes and policies.
The business analyst will have business training and experience, plus knowledge of analysis and design.
Requirements analyst role
The requirements analyst role focuses on eliciting the requirements from the stakeholders associated with the new system.
As more organizations recognize the critical role that complete and accurate requirements play in the ultimate success of the system, this specialty has gradually evolved.
Requirements analysts understand the business well, are excellent communicators, and are highly skilled in an array of requirements elicitation techniques.
Infrastructure analyst role
The infrastructure analyst role focuses on technical issues surrounding the ways the system will interact with the organization’s technical infrastructure (hardware, software, networks, and databases).
The infrastructure analyst will have significant training and experience in networking, database administration, and various hardware and software products.
Change management analyst role
The change management analyst role focuses on the people and management issues surrounding the system installation.
This person ensures that adequate documentation and support are available to users, provides user training on the new system, and develops strategies to overcome resistance to change.
The change management analyst will have significant training and experience in organizational behavior and specific expertise in change management.
Project manager role
The project manager role ensures that the project is completed on time and within budget and that the system delivers the expected value to the organization.
The project manager is often a seasoned systems analyst who, through training and experience, has acquired specialized project management knowledge and skills.
Assignment
Suppose you decide to become an analyst after you graduate. What type of analyst would you most prefer to be? What type of courses should you take before you graduate? What type of internship should you seek?
QUESTION:
Develop a short plan that describes how you will prepare for your career as an analyst.
THE SYSTEMS DEVELOPMENT LIFE CYCLE
In many ways, building an information system is similar to building a house.
THE SYSTEMS DEVELOPMENT LIFE CYCLE
First, the owner describes the vision for the house to the developer.
Second, this idea is transformed into sketches and drawings that are shown to the owner and refined (often, through several drawings, each improving on the other) until the owner agrees that the pictures depict what he or she wants.
Third, a set of detailed blue-prints is developed that presents much more specific information about the house (e.g., the layout of rooms, placement of plumbing fixtures and electrical outlets, and so on).
Finally, the house is built following the blueprints and often with some changes and decisions made by the owner as the house is erected.
Building an information system using the SDLC follows a similar set of four fundamental phases:
System analysis, a method of studying a system by examining its component parts and their interactions.
•It provides a framework in which judgments of the experts in different fields can be combined to determine what must be done, and what is the best way to accomplish it in light of current and future needs.
•The system analyst (usually a software engineer or programmer) examines the flow of documents, information, and material to design a system that best meets the cost, performance, and scheduling objectives.
•Systems design is the process of defining the architecture, components, modules, interfaces, and data for a system to satisfy specified requirements.
•Systems design could be seen as the application of systems theory to product development.
Successful Systems
•How will you know if you’ve helped to produce a successful system?
•Does the system achieve the goals set for it?
•How well does the system fit the structure of the business for which it was developed?
•Is the new system accurate, secure and reliable?
•Is the system well documented and easy to understand? •
It shows an industrial organization with subsystems for: •Marketing and Purchasing: •These are the main links with the environment as represented by customers and suppliers. •It’s important to recognize, however, that the environment also interacts with the organization through legislation, social pressures, competitive forces, the education system and political decisions.
•Production system: •This is concerned with transforming raw materials into finished products. •It applies just as much in service organizations as in traditional manufacturing industry: an architectural drawing office is the equivalent of a motor engine assembly line.
•Support systems: •These are shown as the accounting, personnel and management control subsystems. •For this organization to work effectively it has to make good use of information, so the need arises for information systems that collect, store, transform and display information about the business.
Why businesses should want to develop information systems?
•The introduction of computer-based systems has often enabled work to be done by fewer staff or, more likely nowadays, has permitted new tasks to be undertaken without increasing staffing levels.
•Improve customer service…!
•Computer systems can often allow organizations to serve customers more quickly or to provide them with additional services.
Improve management information….!
•Management decisions can only be as good as the information on which they are based, so many computer systems have been designed to produce more, or more accurate, or more timely information. Modern database query facilities is a good example.
Secure or defend competitive advantage…..!
View of systems
•We can represent information systems structure in two ways: •either in a non-hierarchical way showing each subsystem on the same level, •or in an hierarchical way where some systems sit on top of others. •This multilevel view is often more helpful as it shows the different levels of control, the different data requirements, and a different view of the organization of each system.
Fig. : An hierarchical view of systems
Hierarchical view of systems:
•At the top level are strategic systems and decision support systems that inform the organization.
•Strategic systems use information from lower-level internal systems and externally obtained information about markets, social trends and competitor behavior.
•Underneath strategic systems lie managerial or tactical systems that are concerned with the monitoring and control of business functions. •
•The operational systems level is concerned with the routine processing of transactions such as orders, invoices, schedules and statements.
•Other models
A useful model and widely used model is the Gibson–Nolan four-stage model of: • •Initiation; •Expansion; •Formalization; •Maturity.
Gibson–Nolan four-stage model
•During the initiation phase, the repetitive processing of large volumes of transactions occurs. •Expansion stage apply the new technology to as many applications as possible. •This is the honeymoon period for the system until one day a halt is called to the ever-growing system budget and the introduction of development planning and controls signals the start of the formalization stage.
•During formalization stage the need for information surpasses the need for data and where the organization begins to plan its way from a mixture of separate data processing systems towards a more coordinated and integrated approach. •Corporate recognition of the need for integrated systems is the characteristic of the maturity stage. Here we see the use of open system architectures, database environments and comprehensive systems planning.
Role of the Analyst and Designer
•Analysts and designers are not always the same person
Role of the Analyst and Designer
Attributes analysts or designers should possess.
•Uncover the fundamental issues of a problem. •Able to prepare sound plans and appreciate the effect that new data will have on them, and re-plan appropriately; •To be perceptive but not jump to conclusions, to be persistent to overcome difficulties and obstacles and maintain a planned course of action to achieve results
•To exhibit stamina, strength of character and a sense of purpose essential in a professional specialist •To have a broad flexible outlook, an orderly mind and a disciplined approach, as the job will frequently require working without direct supervision •To possess higher-than-average social skills so as to work well with others, and the ability to express thoughts, ideas, suggestions and proposals clearly, both orally and in writing.
Why do we study systems analysis and design?
•Systems analysis and design, need to analyze data input or data flow systematically, process or transform data, store data, and output information in the context of a particular business. •It is used to analyze, design, and implement improvements in the support of users. •Systems analysis and design involves working with current and eventual users of information systems to support them in working with technologies in an organizational setting.
•Installing a system without proper planning leads to great user dissatisfaction and frequently causes the system to fall into disuse. •Systems analysis and design lends structure to the analysis and design of information systems, a costly endeavor that might otherwise have been done in a haphazard way.
The output of most of the image sensors is an analog signal, and we can not apply digital processing on it because we can not store it. We can not store it because it requires infinite memory to store a signal that can have infinite values. So we have to convert an analog signal into a digital signal. To create an image which is digital, we need to covert continuous data into digital form. There are two steps in which it is done.
Sampling
Quantization
We will discuss sampling now, and quantization will be discussed later on but for now on we will discuss just a little about the difference between these two and the need of these two steps.
Basic idea:
The basic idea behind converting an analog signal to its digital signal is
to convert both of its axis x,yx,y into a digital format. Since an image is continuous not just in its co-ordinates xaxisxaxis, but also in its amplitude yaxisyaxis, so the part that deals with the digitizing of co-ordinates is known as sampling. And the part that deals with digitizing the amplitude is known as quantization.
Sampling.
The term sampling refers to take samples. We digitize x axis in sampling. It is done on independent variable. In case of, equation y = sinx, it is done on x variable. It is further divided into two parts , up sampling and down sampling
If you will look at the above figure, you will see that there are some random variations in the signal. These variations are due to noise. In sampling we reduce this noise by taking samples. It is obvious that more samples we take, the quality of the image would be more better, the noise would be more removed and same happens vice versa.
However, if you take sampling on the x axis, the signal is not converted to digital format, unless you take sampling of the y-axis too which is known as quantization. The more samples eventually means you are collecting more data, and in case of image, it means more pixels.
Relationship with pixels
Since a pixel is a smallest element in an image. The total number of pixels in an image can be calculated as
Pixels = total no of rows * total no of columns.
Lets say we have total of 25 pixels, that means we have a square image of 5 X 5. Then as we have discussed above in sampling, that more samples eventually result in more pixels. So it means that of our continuous signal, we have taken 25 samples on x axis. That refers to 25 pixels of this image. This leads to another conclusion that since pixel is also the smallest division of a CCD array. So it means it has a relationship with CCD array too, which can be explained as this.
Relationship with CCD array
The number of sensors on a CCD array is directly equal to the number of pixels. And since we have concluded that the number of pixels is directly equal to the number of samples, that means that number sample is directly equal to the number of sensors on CCD array.
Oversampling.
In the beginning we have define that sampling is further categorize into two types. Which is up sampling and down sampling. Up sampling is also called as over sampling. The oversampling has a very deep application in image processing which is known as Zooming.
Zooming
We will formally introduce zooming in the upcoming tutorial, but for now on, we will just briefly explain zooming. Zooming refers to increase the quantity of pixels, so that when you zoom an image, you will see more detail. The increase in the quantity of pixels is done through oversampling. The one way to zoom is, or to increase samples, is to zoom optically, through the motor movement of the lens and then capture the image. But we have to do it, once the image has been captured.
There is a difference between zooming and sampling
The concept is same, which is, to increase samples. But the key difference is that while sampling is done on the signals, zooming is done on the digital image.
Quantization
Digitizing a signal
As we have seen in the previous tutorials, that digitizing an analog signal into a digital, requires two basic steps. Sampling and quantization. Sampling is done on x axis. It is the conversion of x axis infinite values to digital values. The below figure shows sampling of a signal.
Sampling with relation to digital images
The concept of sampling is directly related to zooming. The more samples you take, the more pixels, you get. Oversampling can also be called as zooming. This has been discussed under sampling and zooming tutorial.But the story of digitizing a signal does not end at sampling too, there is another step involved which is known as Quantization.
What is quantization
Quantization is opposite to sampling. It is done on y axis. When you are quantizing an image, you are actually dividing a signal into quantapartitions. On the x axis of the signal, are the co-ordinate values, and on the y axis, we have amplitudes. So digitizing the amplitudes is known as Quantization.
Here how it is done
You can see in this image, that the signal has been quantified into three different levels. That means that when we sample an image, we actually gather a lot of values, and in quantization, we set levels to these values. This can be more clear in the image below.
In the figure shown in sampling, although the samples has been taken, but they were still spanning vertically to a continuous range of gray level values. In the figure shown above, these vertically ranging values have been quantized into 5 different levels or partitions. Ranging from 0 black to 4 white. This level could vary according to the type of image you want.
The relation of quantization with gray levels has been further discussed below.
Relation of Quantization with gray level resolution:
The quantized figure shown above has 5 different levels of gray. It means that the image formed from this signal, would only have 5 different colors. It would be a black and white image more or less with some colors of gray. Now if you were to make the quality of the image more better, there is one thing you can do here. Which is, to increase the levels, or gray level resolution up. If you increase this level to 256, it means you have an gray scale image. Which is far better then simple black and white image. Now 256, or 5 or what ever level you choose is called gray level. Remember the formula that we discussed in the previous tutorial of gray level resolution which is,
L= 2^k
We have discussed that gray level can be defined in two ways. Which were these two.
Gray level = number of bits per pixel BPPBPP.
Gray level = number of levels per pixel.
In this case we have gray level is equal to 256. If we have to calculate the number of bits, we would simply put the values in the equation. In case of 256levels, we have 256 different shades of gray and 8 bits per pixel, hence the image would be a gray scale image.
Reducing the gray level
Now we will reduce the gray levels of the image to see the effect on the image.
For example
Lets say you have an image of 8bpp, that has 256 different levels. It is a grayscale image and the image looks something like this.
256 Gray Levels
Now we will start reducing the gray levels. We will first reduce the gray levels from 256 to 128.
128 Gray Levels
There is not much effect on an image after decrease the gray levels to its half. Lets decrease some more.
64 Gray Levels
Still not much effect, then lets reduce the levels more.
32 Gray Levels
Surprised to see, that there is still some little effect. May be its due to reason, that it is the picture of Einstein, but lets reduce the levels more.
16 Gray Levels
Boom here, we go, the image finally reveals, that it is effected by the levels.
8 Gray Levels
4 Gray Levels
Now before reducing it, further two 2 levels, you can easily see that the image has been distorted badly by reducing the gray levels. Now we will reduce it to 2 levels, which is nothing but a simple black and white level. It means the image would be simple black and white image.
2 Gray Levels
Thats the last level we can achieve, because if reduce it further, it would be simply a black image, which can not be interpreted.
Contouring
There is an interesting observation here, that as we reduce the number of gray levels, there is a special type of effect start appearing in the image, which can be seen clear in 16 gray level picture. This effect is known as Contouring.
Image Resolution
Image resolution can be defined in many ways. One type of it which is pixel resolution that has been discussed in the tutorial of pixel resolution and aspect ratio.
Spatial resolution
Spatial resolution states that the clarity of an image cannot be determined by the pixel resolution. The number of pixels in an image does not matter. Spatial resolution can be defined as the in other way we can define spatial resolution as the number of independent pixels values per inch. In short what spatial resolution refers to is that we cannot compare two different types of images to see that which one is clear or which one is not. If we have to compare the two images, to see which one is more clear or which has more spatial resolution, we have to compare two images of the same size.
For example:
You cannot compare these two images to see the clarity of the image.
Although both images are of the same person, but that is not the condition we are judging on. The picture on the left is zoomed out picture of Einstein with dimensions of 227 x 222. Whereas the picture on the right side has the dimensions of 980 X 749 and also it is a zoomed image. We cannot compare them to see that which one is more clear. Remember the factor of zoom does not matter in this condition, the only thing that matters is that these two pictures are not equal.
So in order to measure spatial resolution , the pictures below would server the purpose.
Now you can compare these two pictures. Both the pictures has same dimensions which are of 227 X 222. Now when you compare them, you will see that the picture on the left side has more spatial resolution or it is more clear then the picture on the right side. That is because the picture on the right is a blurred image.
Measuring spatial resolution
Since the spatial resolution refers to clarity, so for different devices, different measure has been made to measure it.
For example
Dots per inch
Lines per inch
Pixels per inch
They are discussed in more detail in the next tutorial but just a brief introduction has been given below.
Dots per inch
Dots per inch or DPI is usually used in monitors.
Lines per inch
Lines per inch or LPI is usually used in laser printers.
Pixel per inch
Pixel per inch or PPI is measure for different devices such as tablets , Mobile phones e.t.c.
Gray level resolution
Gray level resolution refers to the predictable or deterministic change in the shades or levels of gray in an image. In short gray level resolution is equal to the number of bits per pixel. We have already discussed bits per pixel in our tutorial of bits per pixel and image storage requirements. We will define bpp here briefly.
BPP
The number of different colors in an image is depends on the depth of color or bits per pixel.
Mathematically
The mathematical relation that can be established between gray level resolution and bits per pixel can be given as.
L = 2^k
In this equation L refers to number of gray levels. It can also be defined as the shades of gray. And k refers to bpp or bits per pixel. So the 2 raise to the power of bits per pixel is equal to the gray level resolution.
For example:
The above image of Einstein is an gray scale image. Means it is an image with 8 bits per pixel or 8bpp. Now if were to calculate the gray level resolution, here how we gonna do it. It means it gray level resolution is 256. Or in other way we can say that this image has 256 different shades of gray. The more is the bits per pixel of an image, the more is its gray level resolution.
Defining gray level resolution in terms of bpp
It is not necessary that a gray level resolution should only be defined in terms of levels. We can also define it in terms of bits per pixel.
For example
If you are given an image of 4 bpp, and you are asked to calculate its gray level resolution. There are two answers to that question. The first answer is 16 levels. The second answer is 4 bits.
Finding bpp from Gray level resolution
You can also find the bits per pixels from the given gray level resolution. For this, we just have to twist the formula a little.
Equation 1.
L = 2^k
where k=8
l =2^8
L=256
This formula finds the levels. Now if we were to find the bits per pixel or in this case k, we will simply change it like this.
K = log base 2LL Equation 22
Because in the first equation the relationship between Levels LL and bits per pixel kk is exponentional. Now we have to revert it, and thus the inverse of exponentional is log. Lets take an example to find bits per pixel from gray level resolution.
For example:
If you are given an image of 256 levels. What is the bits per pixel required for it.
Putting 256 in the equation, we get.
K = log base 2 256256 K = 8.
So the answer is 8 bits per pixel.
Gray level resolution and quantization:
The quantization will be formally introduced in the next tutorial, but here we are just going to explain the relation ship between gray level resolution and quantization. Gray level resolution is found on the y axis of the signal. In the tutorial of Introduction to signals and system, we have studied that digitizing a an analog signal requires two steps. Sampling and quantization.
Sampling is done on x axis. And quantization is done in Y axis.
So that means digitizing the gray level resolution of an image is done in quantization.
There are many type of images, and we will look in detail about different types of images, and the color distribution in them.
The binary image
The binary image as it name states, contain only two pixel values.
0 and 1.
In our previous tutorial of bits per pixel, we have explained this in detail about the representation of pixel values to their respective colors.
Here 0 refers to black color and 1 refers to white color. It is also known as Monochrome.
Black and white image:
The resulting image that is formed hence consist of only black and white color and thus can also be called as Black and White image.
No gray level
One of the interesting this about this binary image that there is no gray level in it. Only two colors that are black and white are found in it.
Format
Binary images have a format of PBM Portable bitmap
2, 3, 4,5, 6 bit color format
The images with a color format of 2, 3, 4, 5 and 6 bit are not widely used today. They were used in old times for old TV displays, or monitor displays.
But each of these colors have more then two gray levels, and hence has gray color unlike the binary image.
In a 2 bit 4, in a 3 bit 8, in a 4 bit 16, in a 5 bit 32, in a 6 bit 64 different colors are present.
8 bit color format
8 bit color format is one of the most famous image format. It has 256 different shades of colors in it. It is commonly known as Grayscale image.
The range of the colors in 8 bit vary from 0-255. Where 0 stands for black, and 255 stands for white, and 127 stands for gray color.
This format was used initially by early models of the operating systems UNIX and the early color Macintoshes.
A grayscale image of Einstein is shown below:
Format
The format of these images are PGM Portable Gray Map
This format is not supported by default from windows. In order to see gray scale image, you need to have an image viewer or image processing toolbox such as Matlab.
Behind gray scale image:
As we have explained it several times in the previous tutorials, that an image is nothing but a two dimensional function, and can be represented by a two dimensional array or matrix. So in the case of the image of Einstein shown above, there would be two dimensional matrix in behind with values ranging between 0 and 255.
But thats not the case with the color images.
16 bit color format
It is a color image format. It has 65,536 different colors in it. It is also known as High color format.
It has been used by Microsoft in their systems that support more then 8 bit color format. Now in this 16 bit format and the next format we are going to discuss which is a 24 bit format are both color format.
The distribution of color in a color image is not as simple as it was in grayscale image.
A 16 bit format is actually divided into three further formats which are Red , Green and Blue. The famous RGB format.
It is pictorially represented in the image below.
Figure 1: Einstein (Left); 16 bit Format (Right)
Now the question arises, that how would you distribute 16 into three. If you do it like this,
5 bits for R, 5 bits for G, 5 bits for B
Then there is one bit remains in the end.
So the distribution of 16 bit has been done like this.
5 bits for R, 6 bits for G, 5 bits for B.
The additional bit that was left behind is added into the green bit. Because green is the color which is most soothing to eyes in all of these three colors.
Note this is distribution is not followed by all the systems. Some have introduced an alpha channel in the 16 bit.
Another distribution of 16 bit format is like this:
bits for R, 4 bits for G, 4 bits for B, 4 bits for alpha channel.
Or some distribute it like this
bits for R, 5 bits for G, 5 bits for B, 1 bits for alpha channel.
24 bit color format
24 bit color format also known as true color format. Like 16 bit color format, in a 24 bit color format, the 24 bits are again distributed in three different formats of Red, Green and Blue. From figure instead of 16 use 24 bit format R, G, and B in same bit.
Since 24 is equally divided on 8, so it has been distributed equally between three different color channels.
Their distribution is like this.
8 bits for R, 8 bits for G, 8 bits for B.
Behind a 24 bit image.
Unlike a 8 bit gray scale image, which has one matrix behind it, a 24 bit image has three different matrices of R, G, B.
Color Codes Conversion Different color codes
All the colors here are of the 24 bit format, that means each color has 8 bits of red, 8 bits of green, 8 bits of blue, in it. Or we can say each color has three different portions. You just have to change the quantity of these three portions to make any color.
Binary color format
Color: Black Image
Decimal Code:
0,0,00,0,0
Explanation:
As it has been explained in the previous tutorials, that in an 8-bit format, 0 refers to black. So if we have to make a pure black color, we have to make all the three portion of R, G, B to 0. Color: White Image:
Decimal Code:
255,255,255255,255,255
Explanation:
Since each portion of R, G, B is an 8 bit portion. So in 8-bit, the white color is formed by 255. It is explained in the tutorial of pixel. So in order to make a white color we set each portion to 255 and thats how we got a white color. By setting each of the value to 255, we get overall value of 255, thats make the color white.
RGB color model:
Color: Red Image
Decimal Code:
255,0,0255,0,0
Explanation:
Since we need only red color, so we zero out the rest of the two portions which are green and blue, and we set the red portion to its maximum which is 255.
Color: Green Image
Decimal Code:
0,255,00,255,0
Explanation:
Since we need only green color, so we zero out the rest of the two portions which are red and blue, and we set the green portion to its maximum which is 255.
Color: Blue Image
Decimal Code:
0,0,2550,0,255
Explanation:
Since we need only blue color, so we zero out the rest of the two portions which are red and green, and we set the blue portion to its maximum which is 255
Gray color:
Color: Gray Image
Decimal Code:
128,128,128128,128,128
Explanation
As we have already defined in our tutorial of pixel, that gray color Is actually the mid point. In an 8-bit format, the mid point is 128 or 127. In this case we choose 128. So we set each of the portion to its mid point which is 128, and that results in overall mid value and we got gray color.
CMYK color model:
CMYK is another color model where c stands for cyan, m stands for magenta, y stands for yellow, and k for black. CMYK model is commonly used in color printers in which there are two carters of color is used. One consist of CMY and other consist of black color.
The colors of CMY can also made from changing the quantity or portion of red, green and blue.
Color: Cyan Image:
Decimal Code:
0,255,2550,255,255
Explanation:
Cyan color is formed from the combination of two different colors which are Green and blue. So we set those two to maximum and we zero out the portion of red. And we get cyan color.
Color: Magenta Image
Decimal Code:
255,0,255255,0,255
Explanation:
Magenta color is formed from the combination of two different colors which are Red and Blue. So we set those two to maximum and we zero out the portion of green. And we get magenta color.
Color: Yellow Image
Decimal Code:
255,255,0255,255,0
Explanation:
Yellow color is formed from the combination of two different colors which are Red and Green.
So we set those two to maximum and we zero out the portion of blue. And we get yellow color.
Conversion
Now we will see that how color are converted are from one format to another.
Conversion from RGB to Hex code:
Conversion from Hex to rgb is done through this method:
Take a color. E.g: White = 255,255,255255,255,255.
Take the first portion e.g 255.
Divide it by 16. Like this:
Take the two numbers below line, the factor, and the remainder. In this case it is 15 15 which is FF.
Repeat the step 2 for the next two portions. Combine all the hex code into one.
Answer: #FFFFFF
Conversion from Hex to RGB:
Conversion from hex code to rgb decimal format is done in this way.
Take a hex number. E.g: #FFFFFF
Break this number into 3 parts: FF FF FF
Take the first part and separate its components: F F
Convert each of the part separately into binary: 11111111 11111111
Now combine the individual binaries into one: 11111111
Convert this binary into decimal: 255
Now repeat step 2, two more times.
The value comes in the first step is R, second one is G, and the third one belongs to B.
Answer: 255,255,255255,255,255
Common colors and their Hex code has been given in this table.
Color
Hex Code
Black
#000000
White
#FFFFFF
Gray
#808080
Red
#FF0000
Green
#00FF00
Blue
#0000FF
Cyan
#00FFFF
Magenta
#FF00FF
Yellow
#FFFF00
Grayscale to RGB Conversion
Now we will convert an color image into a grayscale image. There are two methods to convert it. Both has their own merits and demerits. The methods are:
Average method
Weighted method or luminosity method
Average method
Average method is the most simple one. You just have to take the average of three colors. Since its an RGB image, so it means that you have add r with g with b and then divide it by 3 to get your desired grayscale image.
Its done in this way.
Grayscale = R+G+B/3R+G+B/3 For example:
If you have an color image like the image shown above and you want to convert it into grayscale using average method. The following result would appear.
Explanation
There is one thing to be sure, that something happens to the original works. It means that our average method works. But the results were not as expected. We wanted to convert the image into a grayscale, but this turned out to be a rather black image.
Problem
This problem arise due to the fact, that we take average of the three colors. Since the three different colors have three different wavelength and have their own contribution in the formation of image, so we have to take average according to their contribution, not done it averagely using average method. Right now what we are doing is this,
33% of Red, 33% of Green, 33% of Blue
We are taking 33% of each, that means, each of the portion has same contribution in the image. But in reality thats not the case. The solution to this has been given by luminosity method.
Weighted method or luminosity method
You have seen the problem that occur in the average method. Weighted method has a solution to that problem. Since red color has more wavelength of all the three colors, and green is the color that has not only less wavelength then red color but also green is the color that gives more soothing effect to the eyes.
It means that we have to decrease the contribution of red color, and increase the contribution of the green color, and put blue color contribution in between these two.
So the new equation that form is:
New grayscale image = (0.3R(0.3 R + 0.59 G0.59 G + 0.11 B0.11 B ).
According to this equation, Red has contribute 30%, Green has contributed 59% which is greater in all three colors and Blue has contributed 11%.
Applying this equation to the image, we get this
Original Image: Grayscale Image:
Explanation
As you can see here, that the image has now been properly converted to grayscale using weighted method. As compare to the result of average method, this image is more brighter.
Pixel is the smallest element of an image. Each pixel correspond to any one value. In an 8-bit gray scale image, the value of the pixel between 0 and 255. The value of a pixel at any point correspond to the intensity of the light photons striking at that point. Each pixel store a value proportional to the light intensity at that particular location.
PEL
A pixel is also known as PEL. You can have more understanding of the pixel from the pictures given below.
In the above picture, there may be thousands of pixels, that together make up this image. We will zoom that image to the extent that we are able to see some pixels division. It is shown in the image below.
figure 1
Relationship with CCD array
We have seen that how an image is formed in the CCD array. So a pixel can also be defined as
The smallest division the CCD array is also known as pixel.
Each division of CCD array contains the value against the intensity of the photon striking to it. This value can also be called as a pixel.
Calculation of total number of pixels
We have define an image as a two dimensional signal or matrix. Then in that case the number of PEL would be equal to the number of rows multiply with number of columns.
This can be mathematically represented as below:
Total number of pixels = number of rows XX number of columns
Or we can say that the number of x,y coordinate pairs make up the total number of pixels.
We will look in more detail in the tutorial of image types, that how do we calculate the pixels in a color image.
Gray level
The value of the pixel at any point denotes the intensity of image at that location, and that is also known as gray level.
We will see in more detail about the value of the pixels in the image storage and bits per pixel tutorial, but for now we will just look at the concept of only one pixel value.
Pixel value 0.0
As it has already been define in the beginning of this tutorial, that each pixel can have only one value and each value denotes the intensity of light at that point of the image.
We will now look at a very unique value 0. The value 0 means absence of light. It means that 0 denotes dark, and it further means that when ever a pixel has a value of 0, it means at that point, black color would be formed.
Have a look at this image matrix
0
0
0
0
0
0
0
0
0
Now this image matrix has all filled up with 0. All the pixels have a value of 0. If we were to calculate the total number of pixels form this matrix, this is how we are going to do it.
Total no of pixels = total no. of rows X total no. of columns = 3 X 3 = 9.
It means that an image would be formed with 9 pixels, and that image would have a dimension of 3 rows and 3 column and most importantly that image would be black. The resulting image that would be made would be something like this
Now why is this image all black. Because all the pixels in the image had a value of 0.
Concept of Bits per pixel
Bpp or bits per pixel denotes the number of bits per pixel. The number of different colors in an image is depends on the depth of color or bits per pixel.
Bits in mathematics:
Its just like playing with binary bits.
How many numbers can be represented by one bit. 0,1
How many two bits combinations can be made.
00,01,10,11
If we devise a formula for the calculation of total number of combinations that can be made from bit, it would be like this.
2^bpp
Where bpp denotes bits per pixel. Put 1 in the formula you get 2, put 2 in the formula, you get 4. It grows exponentially.
Number of different colors:
Now as we said it in the beginning, that the number of different colors depend on the number of bits per pixel.
The table for some of the bits and their color is given below.
This table shows different bits per pixel and the amount of color they contain.
Shades
You can easily notice the pattern of the exponentional growth. The famous gray scale image is of 8 bpp , means it has 256 different colors in it or 256 shades.
Shades can be represented as:
Color images are usually of the 24 bpp format, or 16 bpp.
We will see more about other color formats and image types in the tutorial of image types.
Color values:
We have previously seen in the tutorial of concept of pixel, that 0 pixel value denotes black color.
Black color:
Remember, 0 pixel value always denotes black color. But there is no fixed value that denotes white color.
White color:
The value that denotes white color can be calculated as :
In case of 1 bpp, 0 denotes black, and 1 denotes white.
In case 8 bpp, 0 denotes black, and 255 denotes white.
Gray color:
When you calculate the black and white color value, then you can calculate the pixel value of gray color.
Gray color is actually the mid point of black and white. That said,
In case of 8bpp, the pixel value that denotes gray color is 127 or 128bpp ifyoucountfrom1,notfrom0ifyoucountfrom1,notfrom0.
Image storage requirements
After the discussion of bits per pixel, now we have every thing that we need to calculate a size of an image.
Image size
The size of an image depends upon three things.
Number of rows
Number of columns
Number of bits per pixel
The formula for calculating the size is given below.
Size of an image = rows * cols * bpp
It means that if you have an image, lets say the above figure 1:
Assuming it has 1024 rows and it has 1024 columns. And since it is a gray scale image, it has 256 different shades of gray or it has bits per pixel. Then putting these values in the formula, we get
Size of an image = rows * cols * bpp
= 1024 * 1024 * 8
= 8388608 bits.
But since its not a standard answer that we recognize, so will convert it into our format.
Converting it into bytes = 8388608 / 8 = 1048576 bytes.
Converting into kilo bytes = 1048576 / 1024 = 1024kb.
Converting into Mega bytes = 1024 / 1024 = 1 Mb.
Thats how an image size is calculated and it is stored. Now in the formula, if you are given the size of image and the bits per pixel, you can also calculate the rows and columns of the image
You must write a summary of at least 150 words in response to a specific graph (bar, line, or pie graph), table, chart, or procedure in Writing Task 1 of the IELTS Academic test (how something works, how something is done). This job assesses your ability to choose and report the most important aspects, describe and compare data, recognize importance and trends in factual data, and describe a process.
“The market shares of HTC, Huawei, Samsung, Apple and Nokia in 2010 were 12%, 7%, 20%, 16% and 4% globally.”
The above sentence makes it ambiguous to understand which mobile brand had what percentage of market share. If there are more than 2 values/ figures, you should always use ‘consecutively/ sequentially/ respectively‘. Using either of these words would eliminate any doubt about the above sentence as it will clearly state that the percentages of market shares mentioned here would match the mobile brands sequentially (i.e. first one for the first brand, the second one for the second brand and so on.)
“The market shares of HTC, Huawei, Samsung, Apple and Nokia in 2010 were 12%, 7%, 20%, 16% and 4% respectively in the global market.”
Note: You do not need to use ‘consecutively/ sequentially/ respectively’ if there are only two values to write.
Vocabulary to show transitions:
Vocabulary to describe different types of data/trends in a paragraph while showing a smooth and accurate transition is quite important. Following word(s)/ phrase(s) would help you do so in an excellent way…
» Then
» Afterwards
» Following that
» Followed by
» Next
» Subsequently
» Former
» Latter
» After
» Previous
» Prior to
» Simultaneously
» During
» While
» Finally.
Few More Vocabularies:
Few more useful vocabulary to use in your report writing:
» Stood at
» A marked increase
» Steep
» Gradual
» Hike
» Drastic
» Declivity
» Acclivity
» Prevalent » Plummet
Useful phrases for describing graphs:
» To level off
» To reach a plateau
» To hit the highest point
» To stay constant
» To flatten out
» To show some fluctuation
» To hit the lowest point
» Compared to
» Compared with
» Relative to
Useful Vocabulary for Graphs and Diagrams
To get a high score in Task 1 writing of the academic IELTS you need to give accurate and strong description and analyses for the provided graph(s) or diagram. In this minimum 150 word essay it is easy to keep repeating words and numbers. However, this is not good to achieve a high score. In order to get a great band level on this section of the IELTS, you must use a variety of vocabulary that not only describes but also emphasizes the changes, similarities and differences in the data.
Verbs
These verbs are alternatives to the basic rise and fall vocabulary. One benefit of using them is that sometimes they help you avoid repeating too many numbers. If you have a strong verb, you don’t always have to give the exact figure.
Up Verbs
Verbs
Example
soar
the use of water soared in March
leap
the prices leapt to 90% in one year
Climb
populations climbed to over one million by 1980
Rocket
use of cars rocketed in the first decade
Surge
a surge of migration is seen in November
Notes:
“Soar “and “rocket” are both very strong words that describe large rises. “Rocket” is more sudden. You probably do not need to qualify these verbs with adverbs.
“Leap” shows a large and sudden rise. Again, you probably do not need to qualify it with an adverb.
“Climb” is a relatively neutral verb that can be used with the adverbs below.
Down verbs
Verbs
Example
Sink
The cost of housing sunk after 2008
Slip back
Use of electricity slipped back to 50 in May
Dip
Divorce rate dipped in the 60s
Drop
A drop in crime can be seen last year
Plummet
Tourists to the city plummets after September
Notes:
“Plummet” is the strongest word here. It means to fall very quickly and a long way.
“Drop” and “drop” are normally used for fairly small decreases
“Slip back” is used for falls that come after rises
“Drop” and “Dip” are also frequently used as nouns: “a slight dip” “a sudden drop”
Adjectives and adverbs
This is a selection of some of the most common adjectives and adverbs used for trend language. Please be careful. This is an area where it is possible to make low-level mistakes.
Make sure that you use adjectives with nouns and adverbs with verbs:
a significant rise – correct (adjective/noun)
rose significantly – correct (adverb/verb)
a significantly rise – wrong
Please also note the spelling of the adverbs. There is a particular problem with the word “dramatically:
dramatically – correct
dramaticly – wrong
dramaticaly – wrong
Adjectives of Degree
Adjective
Example
Adverb
Example
Significant
A significant change
Significantly
Changed
significantly
Dramatic
A dramatic shift
Dramatically
Sifts dramatically
Sudden
A sudden rise
Suddenly
Has risen suddenly
Substantial
A substantial gain
Substantially
Gained substantially
Sharp
A sharp decrease
Sharply
Had decreased
sharply
Notes:
“sudden” and “sharp” can be used for relatively minor changes that happen quickly
“spectacular” and “dramatic” are very strong words only used for big changes
Steady Adjectives
Adjective
Example
Adverb
Example
Consistent
A consistent flow
Consistently
Flowed consistently
Steady
A steady movement
Steadily
Moved steadily
Constant
Constant shift
Constantly
Sifted constantly
Small adjectives
Adjective
Example
Adverb
Example
Slight
A slight rise
Slightly
Rose slightly
Gradual
A gradual fall
Gradually
Has fallen gradually
Marginal
A marginal change
Marginally
Had changed
marginally
Modest
A modest increase
Modestly
Increases modestly
Notes:
“marginal” is a particularly useful word for describing very small changes
Other useful adjectives
These adjectives can be used to describes more general trends
Adjective
Example
Upward
By looking at the five data points, there appears to be a clear upward pattern in prices
Downward
Over the past quarter century there is a downward trend in use of pesticides
Overall
The overall shift in the market seems to favour the use of nuclear power
Notes:
“overall” can be used to describe changes in trend over the whole period: very useful in introductions and conclusions
“upward” and “downward” are adjectives: the adverbs are “upwards” and “downwards”
You must write a summary of at least 150 words in response to a specific graph (bar, line, or pie graph), table, chart, or procedure on the IELTS Academic test (how something works, how something is done). Few more informal expressions with their formal versions are given below. Since IELTS is a formal test, your writing should be formal as well. Using informal words or expressions should be avoided. Some of the informal words are so frequently used that it would be tough for you to eliminate them from your writing. However, we would suggest you make a habit of using
Informal
Formal
Go up
Increase
Go down
Decrease
Look at
Examine
Find about
Discover
Point out
Indicate
Need to
Required
Get
Obtain
Think about
Consider
Seem
Appear
Show
demonstrate/
illustrate
Start
Commence
Keep
Retain
But
However
So
Therefore/ Thus
formal words and expressions instead- for your performance and band score’s sake.
Also
In addition/ Additionally
In the meantime
In the interim
In the end
Finally
Anyway
Notwithstanding
Lots of/ a lot of
Much, many
Kids
Children
Cheap
Inexpensive
Right
Correct
I think
In my opinion
IELTS Writing Task 1 vocabulary:
Following are the vocabularies for Academic IELTS Writing Task 1 grouped as Noun, Verb, Adjective, Adverb, and Phrase to help you improve your vocabulary and understanding of the usages of these while describing a graph.
Noun:
Increase:
A growth: There was a growth in the earning of the people of the city at the end of the year. An increase: Between noon and evening, there was an increase in the temperature of the coast area and this was probably because of the availability of sunlight at that time.
A rise: A rise of the listener in the morning can be observed from the bar graph. An improvement: The data show that there was an improvement in the traffic condition between 11:00 am till 3:00 pm.
A progress: There was progress in the law and order of the city during the end of the last year.
Rapid Increase:
A surge: From the presented information, it is clear that there was a surge in the number of voters in 1990 compared to the data given for the previous years.
A rapid increase/ a rapid growth/ a rapid improvement: There was a rapid growth in the stock value of the company ABC during December of the last year.
N.B: Following adjectives can be used before the above nouns to show a rapid growth/ increase of something:
Rapid, Sudden, Steady, Noticeable, Mentionable, Tremendous, huge, enormous, massive, vast, gigantic, monumental, incredible, fabulous, great etc.
(The above list is the words which are actually adjective and can be used before nouns to show the big changes)
Highest:
A/ The peak: Visitors number reached a peak in 2008 and it exceeded 2 million.
Top/ highest/ maximum: The oil prices reached the top/ highest in 1981 during the war.
N.B: Some of the words to present the highest/ top of something are given below:
A fluctuation: There was a fluctuation in the passenger numbers who used railway transportation during the year 2003 to 2004.
A variation: A variation in the shopping habit of teenagers can be observed from the data. A disparately/ dissimilarity/ an inconsistency: The medicine tested among the rabbits shows an inconsistency of the effect it had.
Steadiness:
Stability: The data from the line graph show the stability of the price in the retail market from January till June for the given year.
A plateau: As is presented in the line graph, there was a plateau of the oil price from 1985 to 1990.
Decrease:
A fall: There was a fall in the price of the energy bulbs in 2010 which was less than $5. A decline: A decline occurred after June and the production reached 200/day for the next three months.
A decrease: After the initial four years, the company’s share price increased, and there was a decrease in the bearish market.
Using ‘Nouns’ and ‘Verbs’ to describe trends in a graph:
Direction:
Verbs Nouns
» Increased (to) An increase
» Rose (to) A rise
» Climbed (to) An upward trend
» Went up (to) A growth
Direction:
Verbs Nouns
» Surge A surge
» Boomed (to) A boom / a dramatic increase.
Direction:
Verbs Nouns
» Decreased (to) A decrease
» Declined (to) A decline
» Fell (to) A fall
» Reduce (to) A reduction
» Dipped (to)
» Dropped (to) A drop
» Went down (to) A downward trend
Direction:
Verbs Nouns
» Plunge
» Slumped (to) A slum / a dramatic fall.
» Plummeted (to)
Direction:
Verbs Nouns
» Remained stable (at)
» Remained static (at)
» Remained steady (at)
» Stayed constant (at)
» Levelled out (at) A level out
» Did not change No change
» Remained unchanged No change
» Maintained the same level
» Plateaued (at) A plateau
Direction:
Verbs Nouns
» Fluctuated (around) A fluctuation
» Oscillated An oscillation
Direction:
Verbs Nouns
» Peaked (at) The peak/ apex/ zenith/ summit/ the highest point
Direction:
Verbs Nouns
» Bottomed (at) The lowest point/ the bottom/ bottommost point
Use ‘adjective/adverb’ to indicate the movement of a trend. Examples:
There has been a slight increase in the unemployment rate in 1979 at which point it stood at 12%.
The price of gold dropped rapidly over the next three years.
Use ‘adjective’ to modify the ‘Noun’ form of a trend and use ‘adverb’ to modify the ‘verb’ form of a trend.
Greater or Higher?
We usually use ‘greater’ when we compare two numbers, and ‘higher’ while comparing two percentages or ratio. Reversely, ‘smaller or fewer’ could be used to compare two numbers and
‘lower’ to compare two percentages or ratios. The following table would make it clear —
Examples:
The number of male doctors in this city was greater than the number of female doctors. 2. The number of European programmers who attended the seminar was fewer than the number of Asian programmers.
The percentage of male doctors in this city was higher than the percentage of female doctors.
During 2010, the inflow of illegal immigrants was lower than that of 2012.
the birth rate in Japan in 2014 was higher than the birth rate in 2015.
Vocabulary to compare to what extent / to (/by) what degree something is greater/higher than the other.
about / almost / nearly / roughly / approximately / around / just about / very nearly /
Just over
just above / just over / just bigger / just beyond / just
across
Just short
just below / just beneath / just sort / just under / just a
little
Much more
well above / well above / well beyond / well across / well
over
Much less
well below / well under / well short / well beneath
Example:
The number of high-level women executives is well below the number of male executives
in this organisation, where approximately 2000 people work at executive levels.
About 1000 people died in the highway car accident in 2003 which is well above the statistics of all other years.
The number of domestic violence cases was just below 500 in March which is just a little
over than the previous months.
The average rainfall in London in 2014 was just above the average of two other cities.
The salaries of male executives in three out of four companies were well above the salaries of female executives in 1998.
Expressions to focus on an item in the graph:
Use the following expression to focus on an item in the graph.
» With regards to
» In the case of
» As for
» Turning to
» When it comes to ….. it/ they …..
» Where … is/are concerned,……
» Regarding
Compare and contrast:
Useful Vocabulary to make Comparison and Contrast:
» Similarly, In a similar fashion, In the same way, Same as, As much as, Meanwhile.
» However, On the contrary, on the other hand, in contrast.
Make sure you the appropriate comparative and superlative form of the words when you make a comparison. Here is a basic overview of the comparative and superlative forms to help you remember what you already know.
One-Syllable
Adjectives with one syllable form their comparatives and superlatives form. In your academic writing task 1, you will often use such comparison and contrast related words.
cheap » cheaper » cheapest || large » larger » largest || bright » brighter »
brightest etc.
Exceptions:
good » better » best || bad » worse » worst etc.
Examples:
The fast-food items in uptown restaurants were comparatively cheaper than that of city restaurants.
The largest proportion of water was used in the agriculture sector in most of the Asian countries while the European countries used the highest percentage of water for industrial purposes.
The price of the book in store “A” is cheaper than the price of store “B”.
The temperature decreased further and that made the weather condition worse.
The temperature was better in mid-April but in mid-July, it became worse.
Two Syllables
Some adjectives with two syllables form their comparatives and superlatives: pretty » prettier » prettiest || happy » happier » happiest etc.
Examples:
Customers were happier than now, according to the survey, as the price was cheaper in 1992.
The overall production level of this company made the authority happier as it was doubled in the last quarter of the year.
But many form their comparatives and superlatives using ‘more‘:
striking » more striking » most striking || common » more common » most common|| clever » more clever/cleverer » most clever/cleverest etc.
Three or more Syllables
All adjectives with three or more syllables form their comparatives and superlatives using ‘more’ & ‘most’: attractive » more attractive » most attractive || profitable » more profitable » most profitable || expensive » more expensive » most expensive. Examples:
Custom-made cars were more expensive in 2014 than they are now.
The factory offered more attractive overtime rates and that motivated more employees to work for extra time.
Vocabulary to present Linkers:
..
On the other hand…
..
On the contrary…
..
In contrast…
By comparison… Vocabulary to show that something/a trend is similar or the same:
Use the following vocabularies if both subjects are the same/ identical:
… Identical to/ Identical with …
… Equal to with …
… Exactly the same …
… The same as …
… Precisely the same …
… Absolutely the same … … just the same as …
Use the following vocabularies if both subjects are not identical but similar: … Almost the same as …
… Nearly the same as …
… Practically the same as …
… Almost identical/ similar …
… About the same as …
Way to show that something/a trend is just the reverse/opposite: » The reverse is the case…
» It is quite the opposite/ reverse…
Rules of Time Preposition use:
‘In’
»» Use preposition ‘in’ when you talk about years, months, decades, centuries, seasons.
Example:
Years= in 1998, in 2015 etc.
Months= in January, in December etc.
Decades= in the nineties, in the seventies etc.
Centuries= in the 19th century, in the 14th century, in the 1980s etc.
Seasons= in summer, in winter, in autumn etc.
»» Use preposition ‘in’ to talk about past or future. Example:
Past time= in 1980, in the past, in 1235, in the ice age, in the seventies, in the last century etc.
Future time = in 2030, in the future, in the next century etc. »» Use preposition ‘in’ when you talk about a long period. Example:
in the ice age, in the industrial age, in the iron age etc.
‘On’
»» Use preposition ‘on’ when you talk about days (days of the weeks or special days). Example:
Days of the week= on Sunday, on Friday, on Tuesday.
Special days= on New Year’s Day, on your birthday, on Independence Day, on holiday, on wedding day etc.
»» Use preposition ‘on’ when you talk about dates. Example:
on July 4th, on 21st January 2015, on 5th May etc.
»» Use preposition ‘on’ when you talk about times (like morning/ afternoon/ evening/ night) of a day. Example:
on Friday morning, on Saturday afternoon, on Sunday evening, on Monday evening etc.
However, notice the below list that shows further use of prepositions ‘in’ and ‘on’ for periods of the days versus periods. This is often confusing and mistakenly used by IELTS
candidates. Look at those, notice the use and memorise it.
in
on
in the morning
on Sunday morning
in the afternoon
on Monday afternoon
in the evening
on Tuesday evening
‘At’
»» Use preposition ‘at’ when you need to express an exact time.
Example: At eight o’clock, at 10: 45 am, at two p.m, at nine o’clock.
»» Use preposition ‘at’ when you talk about meal times
Example: At breakfast time, at lunchtime, at dinner time etc.
»» Use preposition ‘at’ when you talk about weekends, holiday periods, or the nighttime.
Example: At the weekend, at Christmas, at Easter, at night etc.
Words to make a comparison /contrast:
A bit/ slightly/ a little/ only just/ approximately/ about/ almost/ precisely/ quite/ nearly/ considerably/ a huge/ a great deal/ quite a lot/ completely/ exactly…
Example:
» This year the population growth of the country is slightly higher than the previous year.
» This year the population grown is almost twice than that of 2007.
» Sale of the company has increased quite a lot this year.
Using Appropriate Prepositions:
You must use the correct preposition in IELTS writing task 1 to get a high score. Be accurate about the uses of to, by, of, off, in, on, for etc. Examples:
» Papers are sold by the ream.
» Oranges are purchased and sold by the dozen.
» Students enrollment in the University has increased by 2% this year.
» Eggs are counted in dozens.
» Rice is measured in kg.
» He is junior to me by 4 years.
» The employees are paid per week in this factory.
» All these products are made of glasses.
Vocabulary – Using the appropriate “Prepositions”:
» It started at…, The sale started at $20…, It peaked at…
» It reached at/to…, It reached the lowest point /nadir at…
»It increased to 80 from 58. It decreased from 10 to 3.
»There was a drop of six units. It dropped by 3 units.
»It declined by 15%. There was a 10% drop in the next three years.
IELTS Academic Writing Task 1 For Vocabulary Date month
From 1990 to 2000, Commencing from 1980, Between 1995 and 2005, After 2012.
By 1995, In 1998, In February, Over the period, During the period, During 2011.
In the first half of the year, For the first quarter, The last quarter of the year, During the first decade.
In the 80s, In the 1980s, During the next 6 months, In the mid-70s, Next 10 years, Previous year, Next year, Between 1980 – 1990.
Within a time span of ten years, within five years.
Next month, Next quarter, Next year, Previous month, Previous year.
Since, Then, From.
Percentage, Portion and Numbers:
Percentages:
10% increase, 25 percent decrease, increased by 15%, dropped by 10 per cent, fall at 50%, reached to 75%, tripled, doubled, one-fourth, three-quarters, half, double fold, treble, 5 times higher, 3 timers lower, declined to about 49%, stood exactly at 43%.
Fractions:
4% = A tiny fraction.
24% = Almost a quarter.
25% Exactly a quarter.
26% = Roughly one quarter.
32% Nearly one-third, nearly a third.
49% = Around a half, just under a half.
50% Exactly a half.
51% = Just over a half.
73% = Nearly three quarters.
77% = Approximately three quarter, more than three-quarter.
79% = Well over three quarters.
Proportions:
2% = A tiny portion, a very small proportion.
4% = An insignificant minority, an insignificant proportion.
16% = A small minority, a small portion.
70% = A large proportion.
72% = A significant majority, A significant proportion.89% = A very large proportion.
89% = A very large proportion.
Words/ Phrases of Approximation – Vocabulary:
» Approximately
» Nearly
» Roughly
» Almost
» About
» Around
» More or less
» Just over
» Just under
» Just around
» Just about
» Just below » A little more than » A little less than. What criteria would a band 9 graph response satisfy?
Task Achievement:
Fully satisfies all the requirements of the task.
Clearly presents a fully developed response.
What will be assessed by the examiner?
How appropriately, accurately and relevantly you fulfil your task requirements.
How accurately you write your report and how appropriately you present the data
(compare/ contrast/ show the most striking trends/ features/ data.)
Coherence and Cohesion:
Uses cohesion in such a way that it attracts no attention.
Skillfully manages “paragraphing”.
What will be assessed by the examiner?
No misinterpretation and presentation of data and trends.
How well you organise your paragraphs.
Overall clarity and fluency of your report and message.
How well you have organised and liked the information, data and ideas in your writing.
Logical sequencing and appropriate use of linking devices between and within your
Tips:
Do not incorporate more than 3-4 paragraphs.
Do not use a single paragraph to describe everything.
The conclusion part is optional. If you think that you have already written more than 170 words and have nothing to say, you can skip the conclusion. Lexical Resource:
Uses a wide range of vocabulary with very natural and sophisticated control of lexical features.
Rare minor errors occur only as “slips”. What will be assessed by the examiner?
The range of vocabulary you have used in your writing.
How accurately and appropriately you have used words/ phrases while presenting thegraph(s) as a report.
Tips: Do NOT use words/ phrases that are already given in the question. Do so only if there is no alternative word(s)/ phrase(s) to convey the same meaning/idea.
Grammatical Range and Accuracy:
Uses a wide range of structures with full flexibility and accuracy.
Rare minor errors occur only as “slips”.
Tips:
Do not use the same sentence structure and data comparison/ contrasting style over and over again. Bring a variety in your writing to show that you can formulate different sentence structures without making any grammatical mistakes.
Vocabulary to represent the highest and lowest points in graphs:
Type
Verb
Noun
Highest Point
peaked / culminated / climaxed /
reach the peak / hit the peak / touch the highest point / reach the vertex/ reach the apex
a (/the) peak / a (/the) pinnacle /
a (/the) vertex / the highest point/ an (/the) apex / a (/the) summit, a (/the) top, a (/the) pinnacle, a (/the) acme, a (/the) zenith,
Lowest Point
touch the lowest point / get the
lowest point / reached the nadir
the lowest point / the lowest
mark / bottommost point / rock bottom point/ bottommost mark / nadir/ the all-time low/ the lowest level/ the bottom/ rock-bottom
Example:
The price of the oil reached a peak amounting $20 in February and again touched the lowest point amounting only $10 in July.
Student enrollment in foreign Universities and Colleges increased dramatically hitting a peak of over 20 thousand in 2004.
The highest number of books was sold in July while it was lowest in December.
The oil price reached a peak in 2003 while it was lowest in 2006.
The selling volume of the DVD hit the peak with 2 million copies sold in a month but after just three months it reached the bottom with only 20 thousand sold in a month.
Vocabulary to show fluctuations/ups and downs/ rise and fall in Verb forms:
» Be erratic
» Rise and fall erratically
» Changes sporadically
» Rise and fall irregularly » Changes Intermittently
Date, month & year related Vocabulary and Grammatical rules:
» Between …(year/ month)… and …(year/ month)…
» From …(year/ month/ day/date)… to …(year/ month/day/date)…
» In …(year/ month)…
» On …(day/ day of the week/ a date)…
» At ……, In ……, By ……
» During … (year)…
» Over the period/ over the century/ later half of the year/ the year…
» Over the next/ past/ previous …….. days/ weeks/ months/ years/ decades…
Presenting Percentages:
You can present “percentage data” in one of three different ways. It is suggested that you use all these formats in your report writing instead of repeating the same style to show percentages in your writing.
% = In percentage / in %. (20%, 25 percentage, ten per cent etc.)
% = In proportion. (two out of five, every student out of three etc.)
% = In fraction. (one-third, two-fifth, a quarter etc.)
Vocabulary to show how many times…
» Exactly the same.
» Roughly the same
» Practically the same
» Twice
» Thrice
» Four times
» Five times
……………
» Ten times
……………
» Hundred times.
Above rules are can be applied through real time examples such as:
1. Compare sections of the pie chart
Householders spend 25% of their household income on food. This is more than five times what they spend on power and just over twice the amount spent on transport, which comes in at 12%. There are many ways to make comparisons, so this gives you a great deal of flexibility. Here are some comparative words that you can use
Most
Least
More
Less
As
Not as
2. Use fractions in place of %
It is not necessary to use percentages in the description of the graph. Fractions work just as well. So, you could say that a quarter of household income is spent on food. This is a great way to show the breadth of your vocabulary.
3. Find other words to describe the graph
So, you could say, for example, that while a quarter of the household income is spent on food each month, at 22%, only slightly less is spent on education. The smallest proportion of the household income pays for power with $5 of every $100 spent on power.
The following words should help you to become more adventurous in your descriptions of the graph.
Proportion
Figure
Number/ amount
One in five, one in ten
4. Try grouping things together and think about how you order the words
So, you could say that almost 60% of household incomes are spent on food, clothing, and education. While households spend almost as much on transport as they do on clothing. When all household expenses are paid most households can save just $15 out of every $100.
Practice
Practice makes perfect, so try to apply the knowledge that we have mentioned above to describe.