Project management
Software project management is an essential part of software engineering. Projects need to be managed because professional software engineering is always subject to organizational budget and schedule constraints. The project manager‘s job is to ensure that the software project meets and overcomes these constraints as well as delivering high-quality software. Good management cannot guarantee project success. However, bad management usually results in project failure: the software may be delivered late, cost more than originally estimated, or fail to meet the expectations of customers.
The success criteria for project management obviously vary from project to project but, for most projects, important goals are:
- Deliver the software to the customer at the agreed time.
- Keep overall costs within budget.
- Deliver software that meets the customer‘s expectations.
- Maintain a happy and well-functioning development team.
These goals are not unique to software engineering but are the goals of all engineering projects. However, software engineering is different from other types of engineering in a number of ways that make software management particularly challenging.
Some of these differences are:
- The product is intangible A manager of a shipbuilding or a civil engineering project can see the product being developed. If a schedule slips, the effect on the product is visible—parts of the structure are obviously unfinished.Software is intangible. It cannot be seen or touched. Software project managers cannot see progress by simply looking at the artifact that is being constructed. Rather, they rely on others to produce evidence that they can use to review the progress of the work.
- Large software projects are often ‗one-off ‘ projects Large software projects are usually different in some ways from previous projects. Therefore, even managers who have a large body of previous experience may find it difficult to anticipate problems. Furthermore, rapid technological changes in computers and communications can make a manager‘s experience obsolete. Lessons learned from previous projects may not be transferable to new projects.
- Software processes are variable and organization-specific The engineering process for some types of system, such as bridges and buildings, is well understood. However, software processes vary quite significantly from one organization to another. Although there has been significant progress in process standardization and improvement, we still cannot reliably predict when a particular software process is likely to lead todevelopment problems. This is especially true when the software project is part of a wider systems engineering project.
It is impossible to write a standard job description for a software project manager. The job varies tremendously depending on the organization and the software product being developed. However, most managers take responsibility at some stage for some or all of the following activities:
- Project planning Project managers are responsible for planning, estimating and scheduling project development, and assigning people to tasks. They supervise the work to ensure that it is carried out to the required standards and monitor progress to check that the development is on time and within budget.
- Reporting Project managers are usually responsible for reporting on the progress of a project to customers and to the managers of the company developing the software. They have to be able to communicate at a range of levels, from detailed technical information to management summaries. They have to write concise, coherent documents that abstract critical information from detailed project reports. They must be able to present this information during progress reviews.
- Risk management Project managers have to assess the risks that may affect a project, monitor these risks, and take action when problems arise.
- People management Project managers are responsible for managing a team of people. They have to choose people for their team and establish ways of working that lead to effective team performance.
- Proposal writing The first stage in a software project may involve writing a proposal to win a contract to carry out an item of work. The proposal describes the objectives of the project and how it will be carried out. It usually includes cost and schedule estimates and justifies why the project contract should be awarded to a particular organization or team. Proposal writing is a critical task as the survival of many software companies depends on having enough proposals accepted and contracts awarded. There can be no set guidelines for this task; proposal writing is a skill that you acquire through practice and experience.
Risk management
Risk management is one of the most important jobs for a project manager. Risk management involves anticipating risks that might affect the project schedule or the quality of the software being developed, and then taking action to avoid these risks (Hall,
1998; Ould, 1999). You can think of a risk as something that you‘d prefer not to have happen. Risks may threaten the project, the software that is being developed, or the organization. There are, therefore, three related categories of risk:
- Project risks Risks that affect the project schedule or resources. An example of a project risk is the loss of an experienced designer. Finding a replacement designer with appropriate skills and experience may take a long time and, consequently, the software design will take longer to complete.
- Product risks Risks that affect the quality or performance of the software being developed. An example of a product risk is the failure of a purchased component to perform as expected. This may affect the overall performance of the system so that it is slower than expected.
- Business risks Risks that affect the organization developing or procuring the software. For example, a competitor introducing a new product is a business risk. The introduction of a competitive product may mean that the assumptions made about sales of existing software products may be unduly optimistic.
| Risk | Affects | Description |
| Staff turnover | Project | Experienced staff will leave the project before it is finished. |
| Management change | Project | There will be a change of organizational management with different priorities. |
| Hardware unavailability | Project | Hardware that is essential for the project will not be delivered on schedule. |
| Requirements change | Project and product | There will be a larger number of changes to the requirements than anticipated. |
| Specification delays | Project and product | Specifications of essential interfaces are not available on schedule. |
| Size underestimate | Project and product | The size of the system has been underestimated. |
| CASE tool under performance | Product | CASE tools, which support the project, do not perform as anticipated. |
| Technology change | Product | Business The underlying technology on which the system is built is superseded by new technology. |
| Product competition | Business | A competitive product is marketed before the system is completed. |
Figure 22.1 Examples of common project, product, and business risks
An outline of the process of risk management is illustrated in Figure 22.2. It involves several stages:
- Risk identification You should identify possible project, product, and business risks.
- Risk analysis You should assess the likelihood and consequences of these risks.
- Risk planning You should make plans to address the risk, either by avoiding it or minimizing its effects on the project.
- Risk monitoring You should regularly assess the risk and your plans for risk mitigation and revise these when you learn more about the risk.
You should document the outcomes of the risk management process in a risk management plan. This should include a discussion of the risks faced by the project, an analysis of these risks, and information on how you propose to manage the risk if it seems likely to be a problem. The risk management process is an iterative process that continues throughout the project. Once you have drawn up an initial risk management plan, you monitor the situation to detect emerging risks.
Figure 22.2 The risk management process
Software pricing
In principle, the price of a software product to a customer is simply the cost of development plus profit for the developer. In practice, however, the relationship between the project cost and the price quoted to the customer is not usually so simple. When calculating a price, you should take broader organizational, economic, political, and business considerations into account, such as those shown in Figure 23.1.
Figure 23.1 Factors affecting software pricing
Project plans
In a plan-driven development project, a project plan sets out the resources available to the project, the work breakdown, and a schedule for carrying out the work. The plan should identify risks to the project and the software under development, and the approach that is taken to risk management. Although the specific details of project plans vary depending on the type of project and organization, plans normally include the following sections:
- Introduction This briefly describes the objectives of the project and sets out the constraints (e.g., budget, time, etc.) that affect the management of the project.
- Project organization This describes the way in which the development team is organized, the people involved, and their roles in the team.
- Risk analysis This describes possible project risks, the likelihood of these risks arising, and the risk reduction strategies that are proposed.
- Hardware and software resource requirements This specifies the hardware and support software required to carry out the development. If hardware has to be bought, estimates of the prices and the delivery schedule may be included.
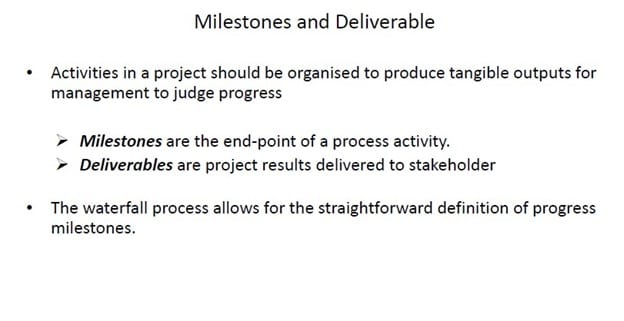
- Work breakdown This sets out the breakdown of the project into activities and identifies the milestones and deliverables associated with each activity. Milestones are key stages in the project where progress can be assessed; deliverables are work products that are delivered to the customer.
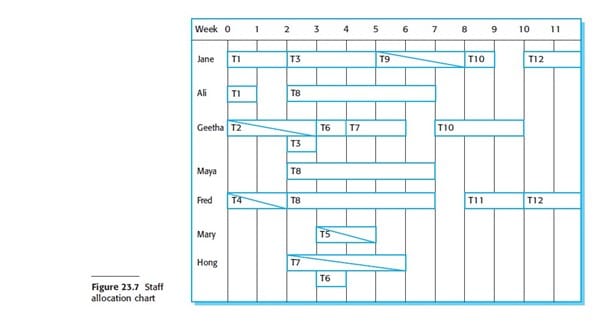
- Project schedule This shows the dependencies between activities, the estimated time required to reach each milestone, and the allocation of people to activities.
- Monitoring and reporting mechanisms This defines the management reports that should be produced, when these should be produced, and the project monitoring mechanisms to be used.
As well as the principal project plan, which should focus on the risks to the projects and the project schedule, you may develop a number of supplementary plans to support other process activities such as testing and configuration management. Examples of possible supplementary plans are shown in Figure 23.2.
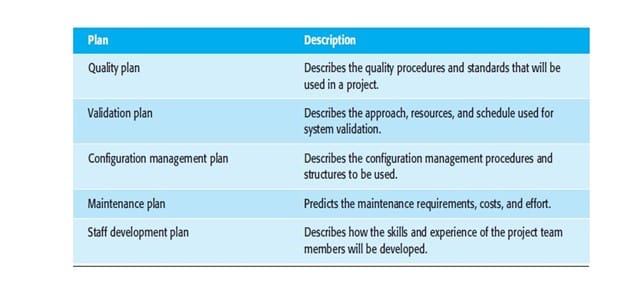
Figure 23.2 Project plan supplements
Project scheduling
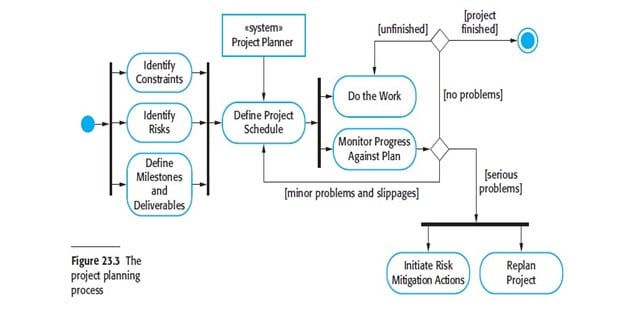
Project scheduling is the process of deciding how the work in a project will be organized as separate tasks, and when and how these tasks will be executed. You estimate the calendar time needed to complete each task, the effort required, and who will work on the tasks that have been identified. You also have to estimate the resources needed to complete each task, such as the disk space required on a server, the time required on specialized hardware, such as a simulator, and what the travel budget will be. In terms of the planning stages that I discussed in the introduction of this chapter, an initial project schedule is usually created during the project startup phase. This schedule is then refined and modified during development planning.
Schedule representation
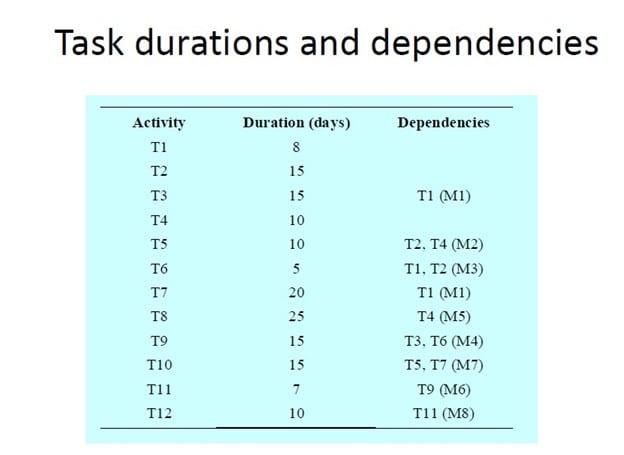
Project schedules may simply be represented in a table or spreadsheet showing the tasks, effort, expected duration, and task dependencies (Figure 23.5). However, this style of representation makes it difficult to see the relationships and dependencies between the different activities. For this reason, alternative graphical representations of project schedules have been developed that are often easier to read and understand.

Figure 23.4 The project scheduling process
There are two types of representation that are commonly used:
- Bar charts, which are calendar-based, show who is responsible for each activity, the expected elapsed time, and when the activity is scheduled to begin and end. Bar charts are sometimes called ‗Gantt charts‘, after their inventor, Henry Gantt.
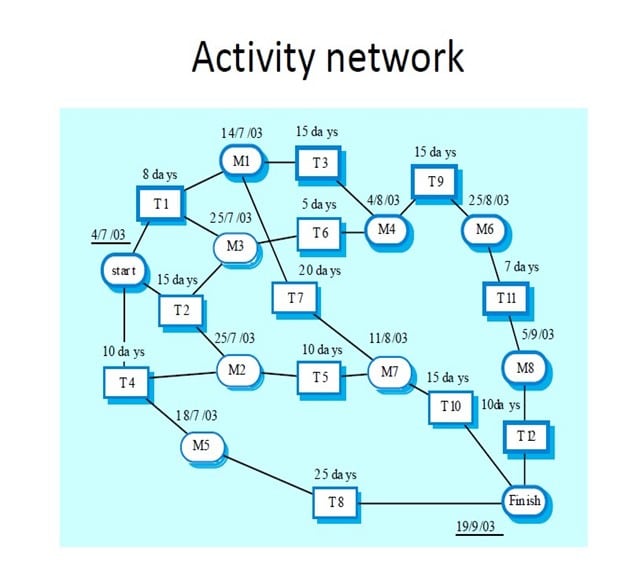
- Activity networks, which are network diagrams, show the dependencies between the different activities making up a project. Normally, a project planning tool is used to manage project schedule information. These tools usually expect you to input project information into a table and will then create a database of project information. Bar charts and activity charts can then be generated automatically from this database.
Project activities are the basic planning element. Each activity has:
- A duration in calendar days or months.
- An effort estimate, which reflects the number of person-days or person-months to complete the work.
- A deadline by which the activity should be completed.
- A defined endpoint. This represents the tangible result of completing the activity. This could be a document, the holding of a review meeting, the successful execution of all tests, etc.
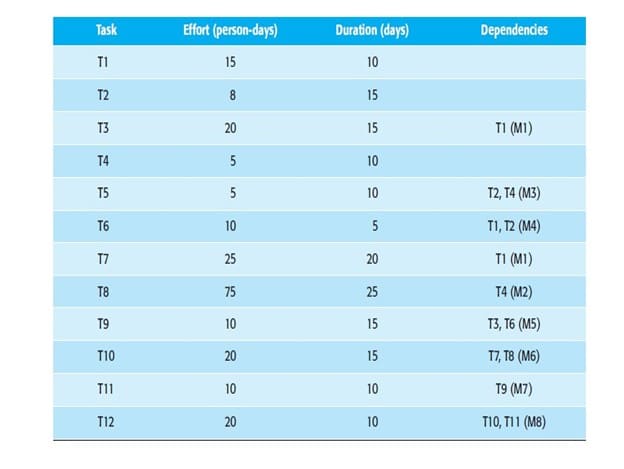
Figure 23.5 Tasks, durations, and dependencies
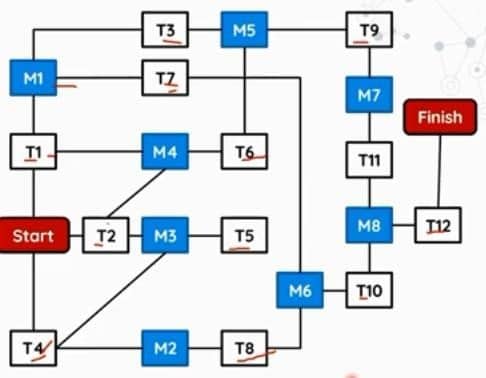
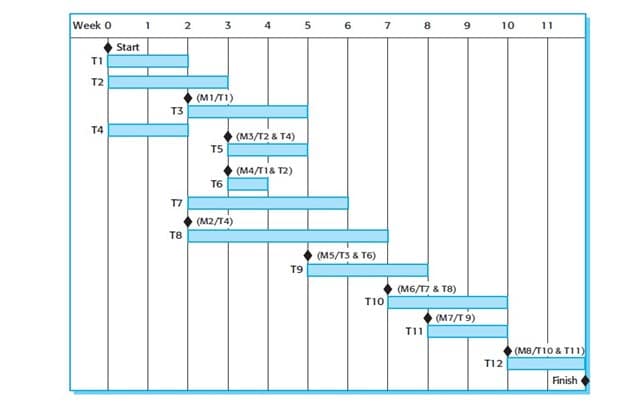
Figure 23.6 Activity bar chart
Problem 1:
- Draw the Activity network diagram for the following task.
- Find the critical path and estimated completion time.
- To shorten the project three week which task will be shorten and what will be the estimated project cost?
| Activity | Preceding Activity | Normal Time | Crash Time | Normal Cost | Crash Cost | Weeks available for crashing | Cost for crashing per week |
| A | – | 4 | 2 | 10,000 | 11,000 | ||
| B | A | 3 | 2 | 6,000 | 4,000 | ||
| C | A | 2 | 1 | 4,000 | 6,000 | ||
| D | B | 5 | 3 | 14,000 | 18,000 | ||
| E | B,C | 1 | 1 | 9,000 | 9,000 | ||
| F | C | 3 | 2 | 7,000 | 8,000 | ||
| G | E,F | 4 | 2 | 13,000 | 25,000 | ||
| H | D,E | 4 | 1 | 11,000 | 18,000 | ||
| I | H,G | 6 | 5 | 20,000 | 24,000 |
Step 1:
Step 1:
| Activity | Preceding Activity | Normal Time | Crash Time | Normal Cost | Crash Cost | Weeks available for crashing | Cost for crashing per week |
| A | – | 4 | 2 | 10,000 | 11,000 | 500 | 2 |
| B | A | 3 | 2 | 7,000 | 4,000 | 3,000 | 1 |
| C | A | 2 | 1 | 4,000 | 6,000 | 2,000 | 1 |
| D | B | 5 | 3 | 14,000 | 18,000 | 2,000 | 2 |
| E | B,C | 1 | 1 | 9,000 | 9,000 | 0 | 0 |
| F | C | 3 | 2 | 7,000 | 8,000 | 1,000 | 1 |
| G | E,F | 4 | 2 | 13,000 | 25,000 | 6,000 | 2 |
| H | D,E | 4 | 1 | 11,000 | 18,000 | 2,333 | 3 |
| I | H,G | 6 | 5 | 20,000 | 24,000 | 4,000 | 1 |

A – B – D – H – I = 22
A – B – E – H – I = 18
A – B – E – G – I = 18
A – C – E – H – I = 17
A – C – E – G – I = 17
A – C – F – G– I = 14
Here the critical path is , A – B – D – H – I = 22

A – B – D – H – I = 22
A – B – E – H – I = 18
A – B – E – G – I = 18
A – C – E – G – I = 17
- – C – F – G– I = 14
1st Week-Activity A-$500
A-3 weeks
ABDHI-21weeks
2nd Week-Activity A-$500
A-2 weeks
ABDHI-21weeks
3rd Week- Activity D-$2000
D- 4 weeks
ABDHI-18 weeks
Project weeks = 10,000 +6,000+4,000+14,000+4,000+7,000+13,000+11,000+20,000
=94,000$
New Project weeks = 11,000 +6,000+4,000+16,000+4,000+7,000+13,000+11,000+20,000
=97,000$
Problem 2:




0 Comments