Gantt chart Project Development

Schedule (project management)
- The project scheduleis the tool that communicates what work needs to be performed, which resources of the organization will perform the work and the timeframes in which that work needs to be performed.
- The project scheduleshould reflect all of the work associated with delivering the project on time.
- In project management, a scheduleis a listing of a project’s milestones, activities, and deliverables, usually with intended start and finish dates.
What is a Gantt chart?
- A chart in which a series of horizontal lines shows the amount of work done or production completed in certain periods of time in relation to the amount planned for those periods.
- To summarize, a Gantt chart shows you what has to be done (the activities) and when (the schedule).
- Gantt charts make it easy to visualize project management timelines by transforming task names, start dates, durations, and end dates into cascading horizontal bar charts.
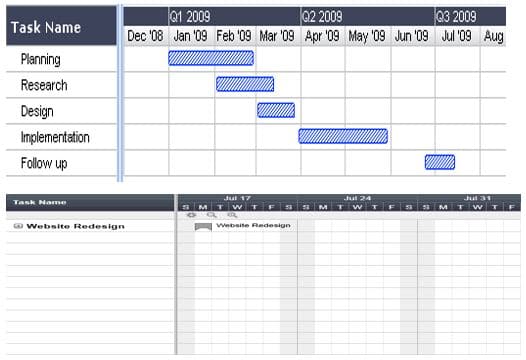
How a Gantt chart look like?
- A Gantt chart, commonly used in project management, is one of the most popular and useful ways of showing activities (tasks or events) displayed against time.
- On the left of the chart is a list of the activities and along the top is a suitable time scale.
- Each activity is represented by a bar; the position and length of the bar reflects the start date, duration and end date of the activity.
Gantt Chart represents..!
- What the various activities are?
- When each activity begins and ends?
- How long each activity is scheduled to last?
- Where activities overlap with other activities, and by how much?
- The start and end date of the whole project?
Advantages of Gantt Charts
- It creates a understandable picture of complexity.if we can see complex ideas as a picture, this will help our understanding.
- It organizes your thoughts.It represents the concept of dividing and conquering. A big problem is conquered by dividing it into component parts.
- It demonstrates that you know what you’re doing.When you produce a nicely presented Gantt chart with high level tasks properly organized and resources allocated to those tasks, it speaks volumes about whether you are on top of the needs of the project and whether the project will be successful.
- It helps you to set realistic time frames.The bars on the chart indicate in which period a particular task or set of tasks will be completed. This can help you to get things in perspective properly. And when you do this, make sure that you think about events in your organization that have nothing to do with this project that might consume resources and time.
- It can be highly visible.It can be useful to place the chart, or a large version of it, where everyone can see it. This helps to remind people of the objectives and when certain things are going to happen. It is useful if everyone in your enterprise can have a basic level of understanding of what is happening with the project even if they may not be directly involved with it.
Disadvantages of Gantt Charts
- They can become extraordinarily complex.Except for the most simple projects, there will be large numbers of tasks undertaken and resources employed to complete the project.
- The size of the bar does not indicate the amount of work.Each bar on the chart indicates the time period over which a particular set of tasks will be completed. However, by looking at the bar for a particular set of tasks, you cannot tell what level of resources are required to achieve those tasks. So, a short bar might take 500 man hours while a longer bar may only take 20 man hours.
- They need to be constantly updated.As you get into a project, things will change. If you’re going to use a Gantt chart you must have the ability to change the chart easily and frequently.
- It does not identify potential weak links between phases . Whenever work is transferred from one person or department to another, your project is subject to potential delay. These weak links are the most common causes of delays.
- It does not reveal the problems your team will encounter due to unexpected delays. The Gantt chartshows only the planned and actual start and completion dates for each phase. It gives you a quick visual overview of the project’s status, but you might need more. The chart does not show how a delay during one phase will impact on the completion of another.
- It does not coordinate the resources or networking requirements needed at critical points in the schedule. Many projects can proceed only when forms, documents, reports, outside help, and other requirements are either developed by your team or supplied by someone else. Thus, a complete schedule should identify these critical points and enable you to plan ahead for the related demands. The Gantt chart does not provide this much detail.
PERT chart (Program Evaluation Review Technique)
- A PERT chart presents a graphic illustration of a project as a network diagram consisting of numbered nodes(either circles or rectangles) representing events, or milestones in the project linked by labelled vectors (directional lines) representing tasks in the project.
- The direction of the arrows on the lines indicates the sequence of tasks.

0 Comments