Identifying the Solution
Often, coding is supposed to be the most essential part of any software development process. However, coding is just a part of the process and may actually take the minimum amount of time if the system is designed correctly. Before the system can be designed, a solution must be identified for the problem at hand.
The first thing to be noted about designing a system is that initially the system analyst may come up with more than one solutions. But the final solution or the product can be only one. In-depth analysis of data gathered during the requirement gathering phase can help in coming to a unique solution. Correctly defining the problem is also crucial for getting to the solution.
When faced with the problem of multiple solutions, analysts go for visual aids like flowcharts, data flow diagrams, entity relationship diagrams, etc. to understand each solution in depth.
Flowcharting
Flowcharting is the process of illustrating workflows and data flows in a system through symbols and diagrams. It is an important tool to assist the system analyst in identifying a solution to the problem. It depicts the components of the system visually.
These are the advantages of flowcharting −
- Visual representation helps in understanding program logic
- They act as blueprints for actual program coding
- Flowcharts are important for program documentation
- Flowcharts are an important aid during program maintenance
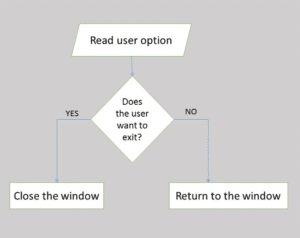
These are the disadvantages of flowcharting −
- Complex logic cannot be depicted using flowcharts
- In case of any change in logic or data/work flow, flowchart has to be redrawn completely
Data Flow Diagram
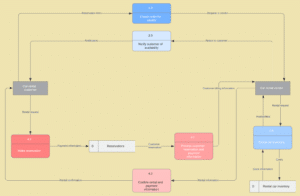
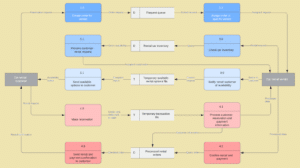
Data flow diagram or DFD is a graphical representation of data flow through a system or sub-system. Each process has its own data flow and there are levels of data flow diagrams. Level 0 shows the input and output data for the whole system. Then the system is broken down into modules and level 1 DFD shows data flow for each module separately. Modules may further be broken down into sub-modules if required and level 2 DFD drawn.
Physical and logical data flow diagrams
To determine whether a physical or logical DFD best suits your needs. Logical data flow diagrams focus on what happens in a particular information flow: what information is being transmitted, what entities are receiving that info, what general processes occur, etc. The processes described in a logical DFD are business activities a logical DFD doesn’t delve into the technical aspects of a process or system. Non-technical employees should be able to understand these diagrams.
Logical Data Flow Diagram
Physical data flow diagrams focus on how things happen in an information flow. These diagrams specify the software, hardware, files, and people involved in an information flow. A detailed physical data flow diagram can facilitate the development of the code needed to implement a data system.
Physical Data Flow Diagram
Both physical and logical data flow diagrams can describe the same information flow. In coordination they provide more detail than either diagram would independently. As you decide which to use, keep in mind that you may need both.
Data flow diagram levels
Data flow diagrams are also categorized by level. Starting with the most basic, level 0, DFDs get increasingly complex as the level increases. As you build your own data flow diagram, you will need to decide which level your diagram will be.
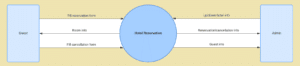
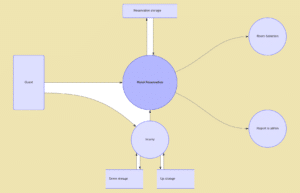
Level 0 DFDs, also known as context diagrams, are the most basic data flow diagrams. They provide a broad view that is easily digestible but offers little detail. Level 0 data flow diagrams show a single process node and its connections to external entities.
Data Flow Diagram Level 0 Template
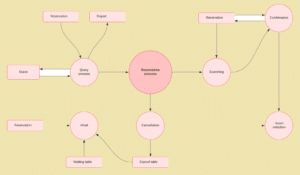
Level 1 DFDs are still a general overview, but they go into more detail than a context diagram. In a level 1 data flow diagram, the single process node from the context diagram is broken down into sub-processes. As these processes are added, the diagram will need additional data flows and data stores to link them together.
Template of Data Flow Diagram Level 1
Level 2+ DFDs simply break processes down into more detailed subprocesses. In theory, DFDs could go beyond level 3, but they rarely do. Level 3 data flow diagrams are detailed enough that it doesn’t usually make sense to break them down further.
Data Flow Diagram Level 2 Template
Data flow diagram symbols and notation
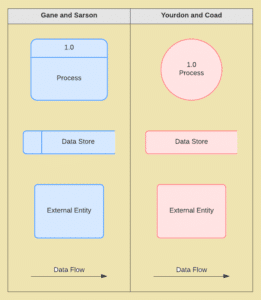
Depending on the methodology (Gane and Sarson vs. Yourdon and Coad), DFD symbols vary slightly. However, the basic ideas remain the same. There are four basic elements of a data flow diagram: processes, data stores, external entities, and data flows. The picture below shows the standard shapes for both methodologies.
Pseudocode
After the system is designed, it is handed over to the project manager for implementation, i.e. coding. The actual coding of a program is done in a programming language, which can be understood only by programmers who are trained in that language. However, before the actual coding occurs, the basic operating principles, work flows and data flows of the program are written using a notation similar to the programming language to be used. Such a notation is called pseudocode.
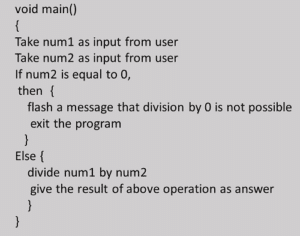
Here is an example of a pseudocode in C++. The programmer just needs to translate each statement into C++ syntax to get the program code.
Identifying Mathematical Operations
All instructions to the computer are finally implemented as arithmetic and logical operations at machine level. These operations are important because they −
- Occupy memory space
- Take time in execution
- Determine software efficiency
- Affect overall software performance
System analysts try to identify all major mathematical operations while identifying the unique solution to problem at hand.
0 Comments